Full Report
Figures converted from IDR to USD at historical FX rates (frankfurter.app). Monetary statements are shown in US$ millions; per-share figures use the matching period rate. Filing links open the native figures from which each USD value was derived.
The numbers behind PT Erajaya Swasembada Tbk: as-reported financial statements and company metrics for FY2021–FY2025, traced to the source filings, opened with the share-price history those statements have to justify. Every linked USD figure opens the exact filing row containing the native reported value from which it was converted. Amounts in US$ millions unless noted.
Reading notes: All figures are as printed by the filings, in thousands of Rupiah (the presentation unit stated on every statement page: 'Expressed in Thousands of Rupiah, Unless Otherwise Stated'). Per-share amounts are in full Rupiah. FY2023-FY2025 figures are cited to Erajaya's standalone audited consolidated financial statements for each year (filed on IDX and indexed under quarterly_reports/Q4_FY20xx); FY2021 and FY2022 are cited to the financial-statement section of those years' annual reports. Both are the same audited statements - the standalone filings were used where the indexed text is cleanest. Erajaya's annual filings print two years per statement, so each fiscal year in the tab is cited to its own filing rather than to a comparative column. Expense, tax and outflow lines are recorded negative because the filings print them in parentheses.
Share Price — Available History Since April 2026
The stock closed at $0.02 on Jul 28, 2026 — down 2% over the window shown, trading between $0.02 and $0.02.
Source: market price feed, daily closes, Apr 2026–Jul 2026 — the feed marks this available history as partial. Price return only, excludes dividends. Prices converted from IDR to USD with date-matched or nearest-available FX.
FY2025 at a Glance
Revenue (US$ millions)
Operating income (US$ millions)
Net income (US$ millions)
Source: FY2025 consolidated statements [1] [2] [3] [4]. Click any linked figure to open the filing page with the row highlighted.
Net Sales by Product Segment
| Net Sales by Product Segment | FY2021 | FY2022 | FY2023 | FY2024 | FY2025 |
|---|---|---|---|---|---|
| Cellular phones and tablets | 2,405 | 2,514 | 3,114 | 3,251 | 3,604 |
| Operator products | 245 | 184 | 189 | 104 | 93 |
| Computer and other electronic devices | 135 | 140 | 154 | 164 | 183 |
| Accessories and others | 258 | 377 | 451 | 529 | 716 |
| Total external sales | 3,043 | 3,216 | 3,909 | 4,047 | 4,596 |
Source: Notes to the consolidated financial statements - Segment Information (external sales) [5] [6] [7] [8]. Click any linked figure to open the filing page with the row highlighted.
Gross Profit by Product Segment
| Gross Profit by Product Segment | FY2021 | FY2022 | FY2023 | FY2024 | FY2025 |
|---|---|---|---|---|---|
| Cellular phones and tablets | 250 | 238 | 299 | 309 | 318 |
| Operator products | 5 | 6 | 5 | 4 | 5 |
| Computer and other electronic devices | 13 | 14 | 12 | 13 | 13 |
| Accessories and others | 68 | 91 | 103 | 126 | 166 |
| Total gross profit per segment | 336 | 349 | 419 | 451 | 501 |
Source: Notes to the consolidated financial statements - Segment Information (gross profit per segment) [5] [6] [7] [8]. Click any linked figure to open the filing page with the row highlighted.
Income Statement
Source: Consolidated Statement of Profit or Loss and Other Comprehensive Income [1] [2] [3] [4]. Click any linked figure to open the filing page with the row highlighted.
Columns marked E are consensus analyst estimates from analyst consensus, shown alongside reported results for direct comparison; they are not company guidance.
Estimate source: analyst consensus (claude_web), as of 2026-07-29. Forecasts carry no filing page links.
Balance Sheet
Source: Consolidated Statement of Financial Position [9] [10] [11] [12]. Click any linked figure to open the filing page with the row highlighted.
Cash Flow
Source: Consolidated Statement of Cash Flows [13] [14] [15] [16]. Click any linked figure to open the filing page with the row highlighted.
Net Sales by Geographic Area
| Net Sales by Geographic Area | FY2021 | FY2022 | FY2023 | FY2024 | FY2025 |
|---|---|---|---|---|---|
| Central area | 2,037 | 2,041 | 2,164 | 2,422 | 2,749 |
| East area | 238 | 277 | 395 | 438 | 499 |
| West area | 767 | 897 | 1,350 | 1,187 | 1,348 |
| Total net sales | 3,043 | 3,216 | 3,909 | 4,047 | 4,596 |
Source: Notes to the consolidated financial statements - Segment Information (customer location: West = Sumatra and Java; Central = Jabodetabek, Kalimantan, Singapore and Malaysia; East = the remainder) [5] [6] [7] [8]. Click any linked figure to open the filing page with the row highlighted.
Retail Network Distribution Reach
| Retail Network Distribution Reach | FY2021 | FY2022 | FY2023 | FY2024 | FY2025 |
|---|---|---|---|---|---|
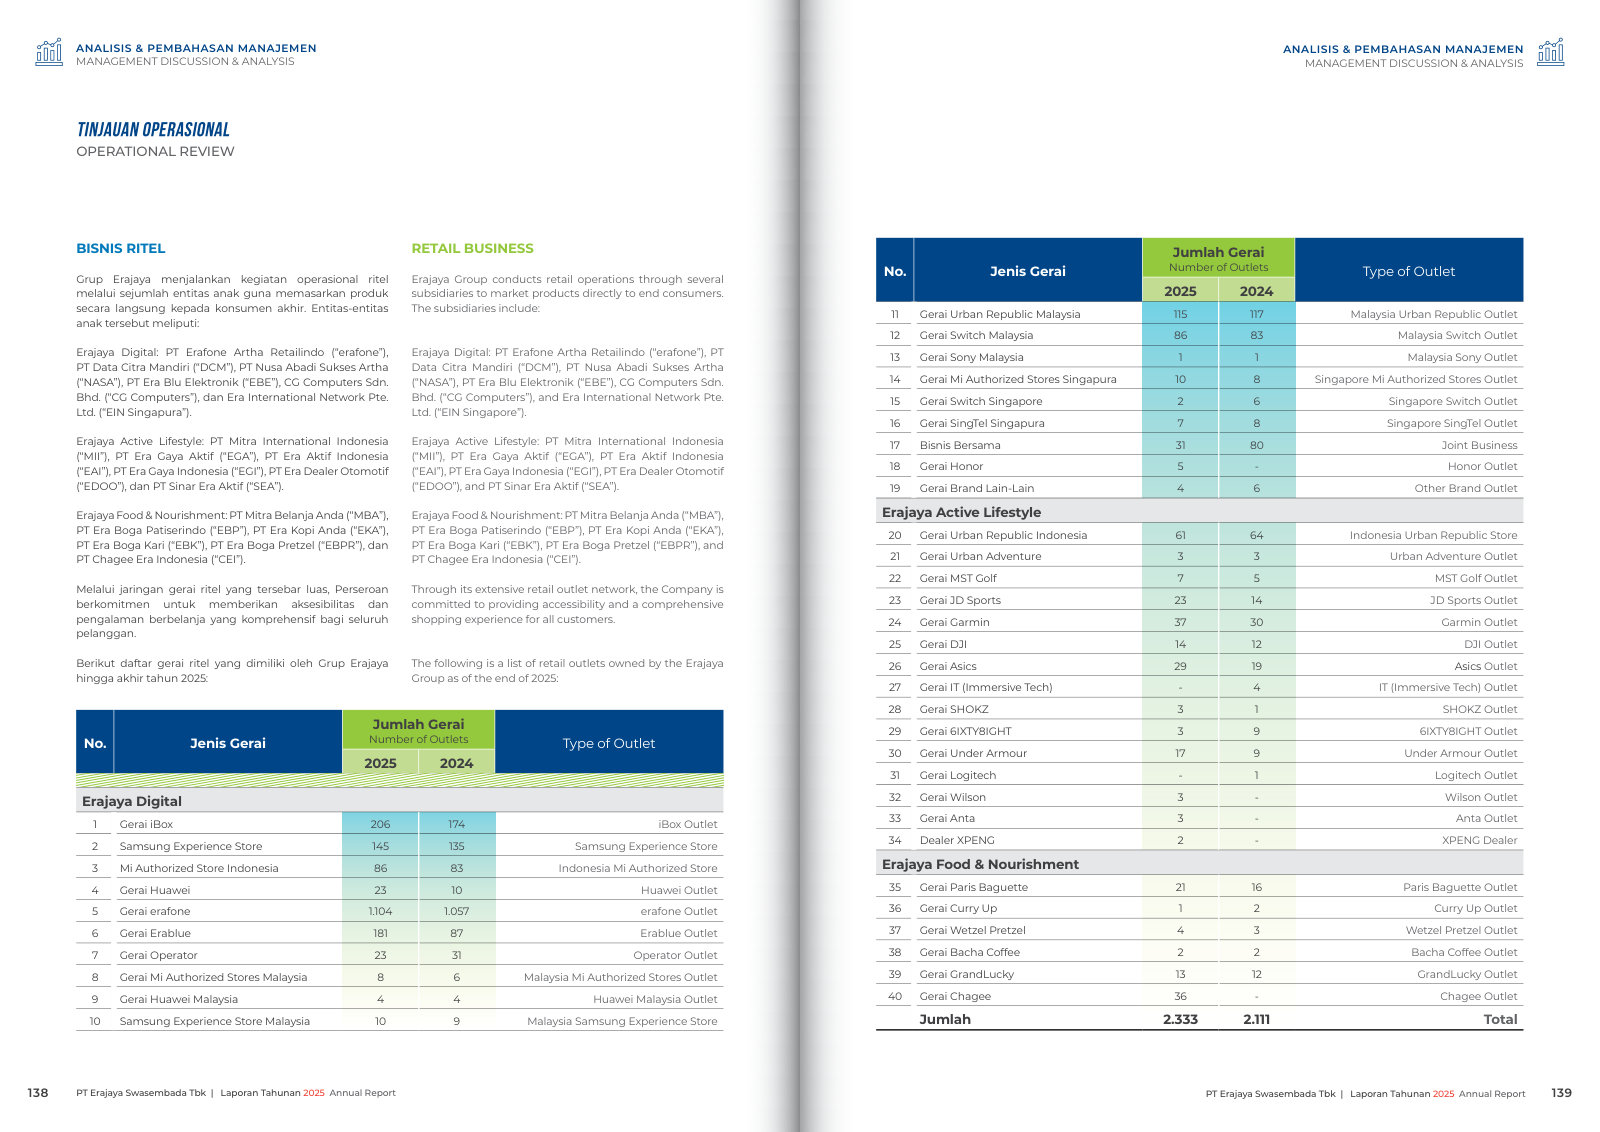
| Retail outlets (year-end) | 1,218 | 1,689 | 2,049 | 2,194 | 2,333 |
| Wholesale distribution points | 88 | 89 | 97 | 77 | 70 |
| Registered third-party resellers | 66,000 | 66,200 | 70,000 | 54,000 | 54,000 |
Source: company filings [17] [18] [19] [20]. Click any linked figure to open the filing page with the row highlighted.
Margins Returns (as reported)
| Margins Returns (as reported) | FY2021 | FY2022 | FY2023 | FY2024 | FY2025 |
|---|---|---|---|---|---|
| Gross profit margin | 11.1% | 10.8% | 10.7% | 11.2% | 10.9% |
| Net profit margin | 2.6% | 2.2% | 1.4% | 1.7% | 1.7% |
| Return on equity | 0.2 | 0.1 | 0.1 | 0.1 | 0.1 |
| Return on assets | 0.1 | 0.1 | 0.0 | 0.1 | 0.1 |
Source: company filings [21] [22]. Click any linked figure to open the filing page with the row highlighted.
Liquidity Leverage (as reported)
| Liquidity Leverage (as reported) | FY2021 | FY2022 | FY2023 | FY2024 | FY2025 |
|---|---|---|---|---|---|
| Current ratio | 1.6 | 1.2 | 1.3 | 1.2 | 1.2 |
| Cash ratio | 0.1 | 0.1 | 0.2 | 0.2 | 0.1 |
| Total liabilities / total equity | 0.8 | 1.4 | 1.5 | 1.4 | 1.8 |
Source: company filings [21] [23] [24]. Click any linked figure to open the filing page with the row highlighted.
Principal Supplier Concentration (% of net sales)
| Principal Supplier Concentration (% of net sales) | FY2021 | FY2022 | FY2023 | FY2024 | FY2025 |
|---|---|---|---|---|---|
| Apple purchases | — | 27.6% | 41.0% | 36.2% | 43.3% |
| Samsung purchases | — | 15.9% | 15.8% | 15.4% | 15.3% |
| Two largest suppliers, combined | — | — | 56.8% | 51.7% | 58.7% |
Source: company filings [25] [26] [27]. Click any linked figure to open the filing page with the row highlighted.
Long-Term Record
| Fiscal year | Net sales | Operating profit | Profit attributable to owners of the parent company | Basic earnings per share (full amount) | Net cash provided by operating activities | Total equity |
|---|---|---|---|---|---|---|
| FY2016 | 1,438 | 37 | 18 | — | 102 | 239 |
| FY2017 | 1,696 | 42 | 24 | — | (54) | 259 |
| FY2018 | 2,432 | 107 | 60 | — | (170) | 338 |
| FY2019 | 2,306 | 54 | 21 | — | 170 | 349 |
| FY2020 | 2,388 | 77 | 43 | 0.00 | 200 | 398 |
| FY2021 | 3,043 | 116 | 71 | 0.00 | 2 | 452 |
| FY2022 | 3,216 | 117 | 66 | 0.00 | 28 | 468 |
| FY2023 | 3,909 | 120 | 54 | 0.00 | 57 | 529 |
| FY2024 | 4,047 | 132 | 64 | 0.00 | 139 | 562 |
| FY2025 | 4,596 | 146 | 72 | 0.00 | 14 | 611 |
Source: consolidated statements across filings; older years from the standardized feed [14] [1] [2] [9]. Click any linked figure to open the filing page with the row highlighted.
Operating KPIs
| KPI | FY2021 | FY2022 | FY2023 | FY2024 | FY2025 |
|---|---|---|---|---|---|
| Number of retail outlets | 1,218 | 1,689 | 2,049 | 2,194 | 2,333 |
| Depreciation and amortization | 38 | 42 | 59 | 71 | 83 |
Source: company-reported operating metrics [5] [6] [7] [28]. Click any linked figure to open the filing page with the row highlighted.
Analyst Consensus
Street ratings: Strong Buy. StockAnalysis.com (July 2026): 8 analysts — 6 Strong Buy, 1 Buy, 1 Hold, 0 Sell, 0 Strong Sell; mean 12-month target 504.29 IDR (low 400, high 680), +30.6% vs 386 IDR. Investing.com concurs: mean 504 IDR, 7 Buy / 1 Hold / 0 Sell, "Strong Buy". Broader local (Bloomberg-sourced) coverage is wider and slightly more bullish: Kontan cites 17 analysts (16 Buy / 1 Hold) with a mean target of Rp537.22; TradingView shows only 4 recent raters (450-500 IDR). Consensus is uniformly bullish with no sell ratings from any source.
Estimate source: analyst consensus (claude_web), as of 2026-07-29. Forecasts carry no filing page links.
Traceability
498 of 518 figures on this page (96%) link to the filing page containing the native reported figure from which the USD value was converted — click a linked figure to open that source row. Unlinked figures come from standardized data feeds or pre-filing years.
All figures are as printed by the filings, in thousands of Rupiah (the presentation unit stated on every statement page: 'Expressed in Thousands of Rupiah, Unless Otherwise Stated'). Per-share amounts are in full Rupiah.
FY2023-FY2025 figures are cited to Erajaya's standalone audited consolidated financial statements for each year (filed on IDX and indexed under quarterly_reports/Q4_FY20xx); FY2021 and FY2022 are cited to the financial-statement section of those years' annual reports. Both are the same audited statements - the standalone filings were used where the indexed text is cleanest.
Erajaya's annual filings print two years per statement, so each fiscal year in the tab is cited to its own filing rather than to a comparative column.
Expense, tax and outflow lines are recorded negative because the filings print them in parentheses.
FY2016-FY2019 long-term figures come from the standardized data feed (data/financials/*.json) and carry no page links; FY2020 is cited to the comparative column of the FY2021 Annual Report. Basic EPS is left blank for FY2016-FY2019 because those years predate the 2021 five-for-one stock split (par value Rp500 to Rp100) and the feed reports them on the pre-split share basis.
The numeric feed agrees with the filings on every checked FY2021-FY2025 line (feed values are full Rupiah, i.e. 1,000x the printed thousands). The entries in 'discrepancies' are filing-versus-filing restatements, not feed conflicts.
Quarterly income-statement and cash-flow figures are single quarters derived from the printed year-to-date statements; Indonesian interim filings present cumulative periods only. Quarterly balance-sheet figures are point-in-time and cited directly. No quarterly cash-flow feed file exists in this run, so the derived quarters could not be cross-checked against a provider series.
Q4 FY24 and Q4 FY25 are derived from the audited full-year statements less the nine-month interim statements.
5 figure(s) differed between the data feed and the filing; the filing value is shown (see the run's metrics/metrics_tab.json for the audit trail).
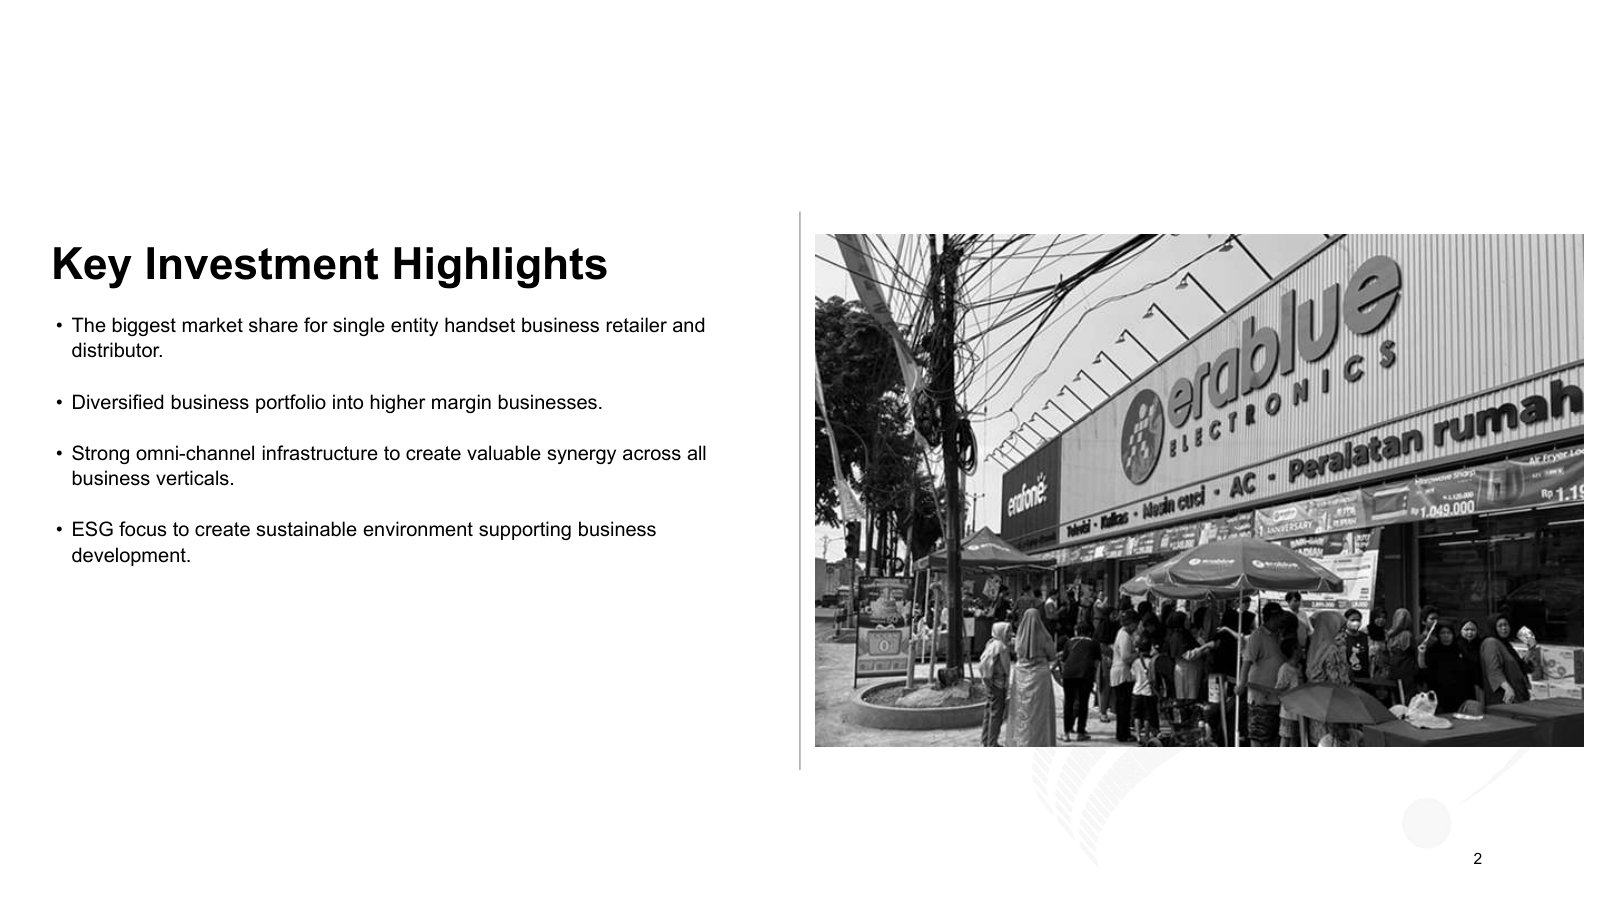
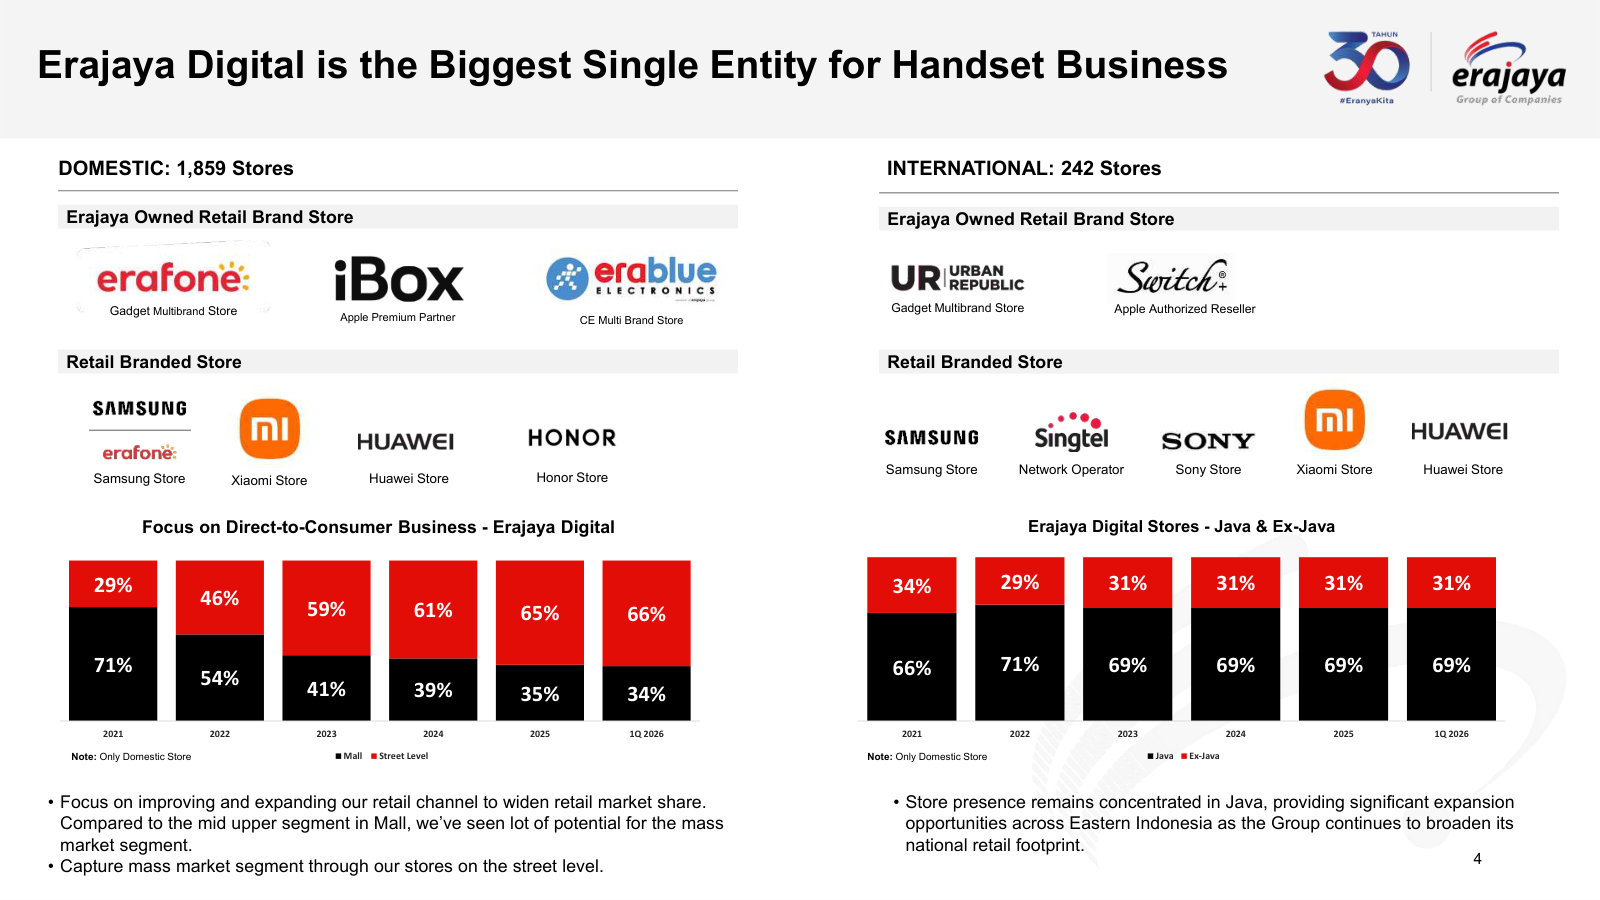
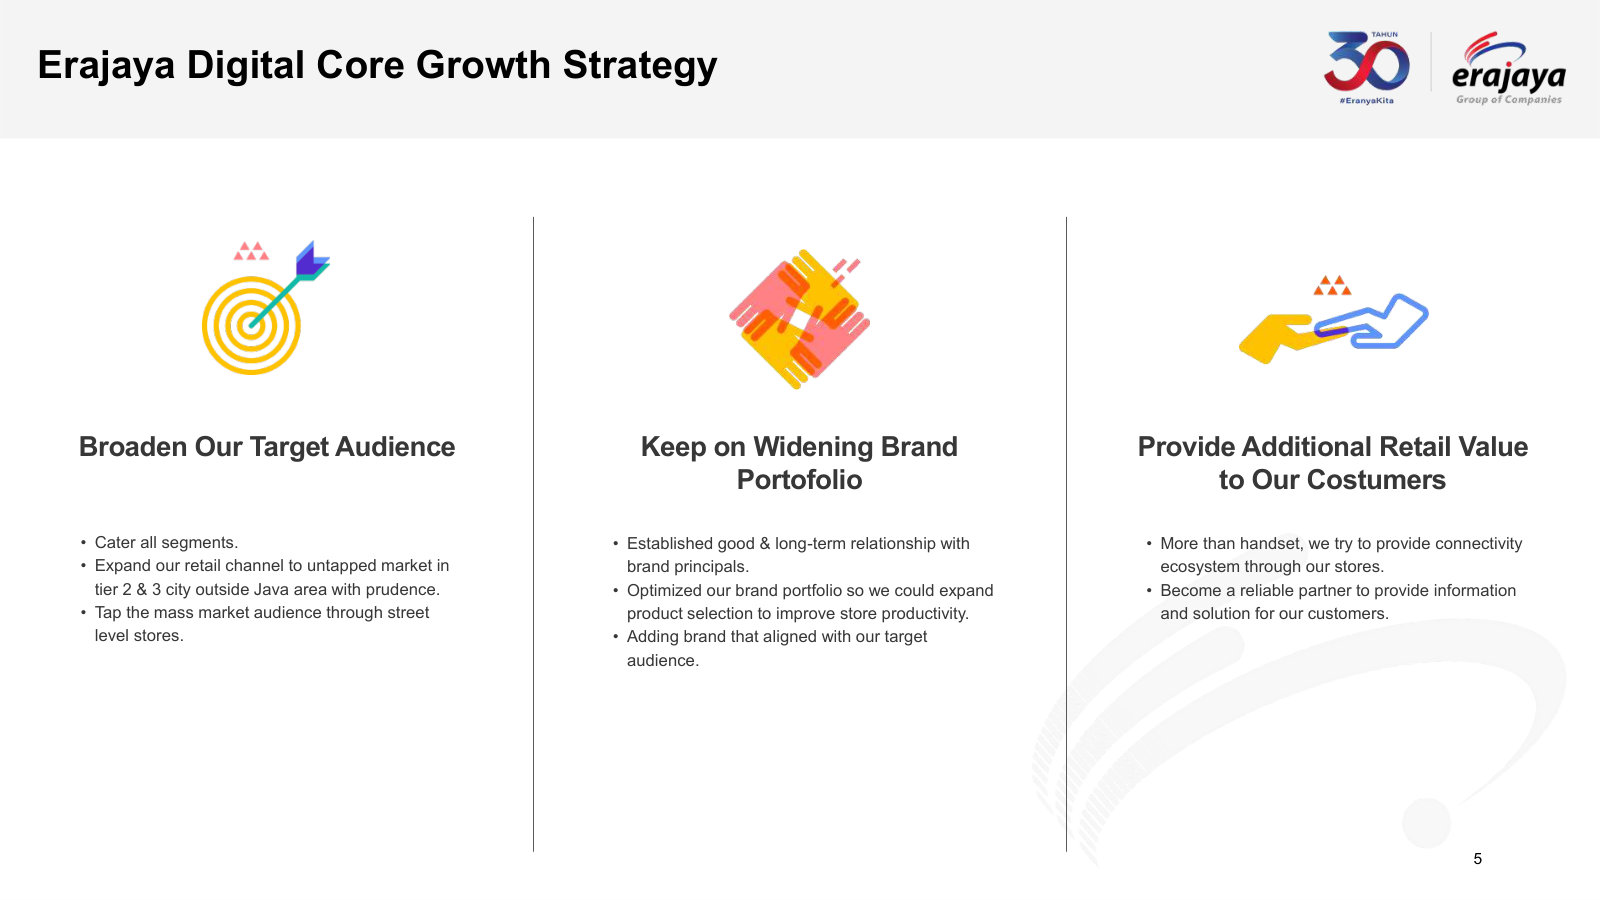
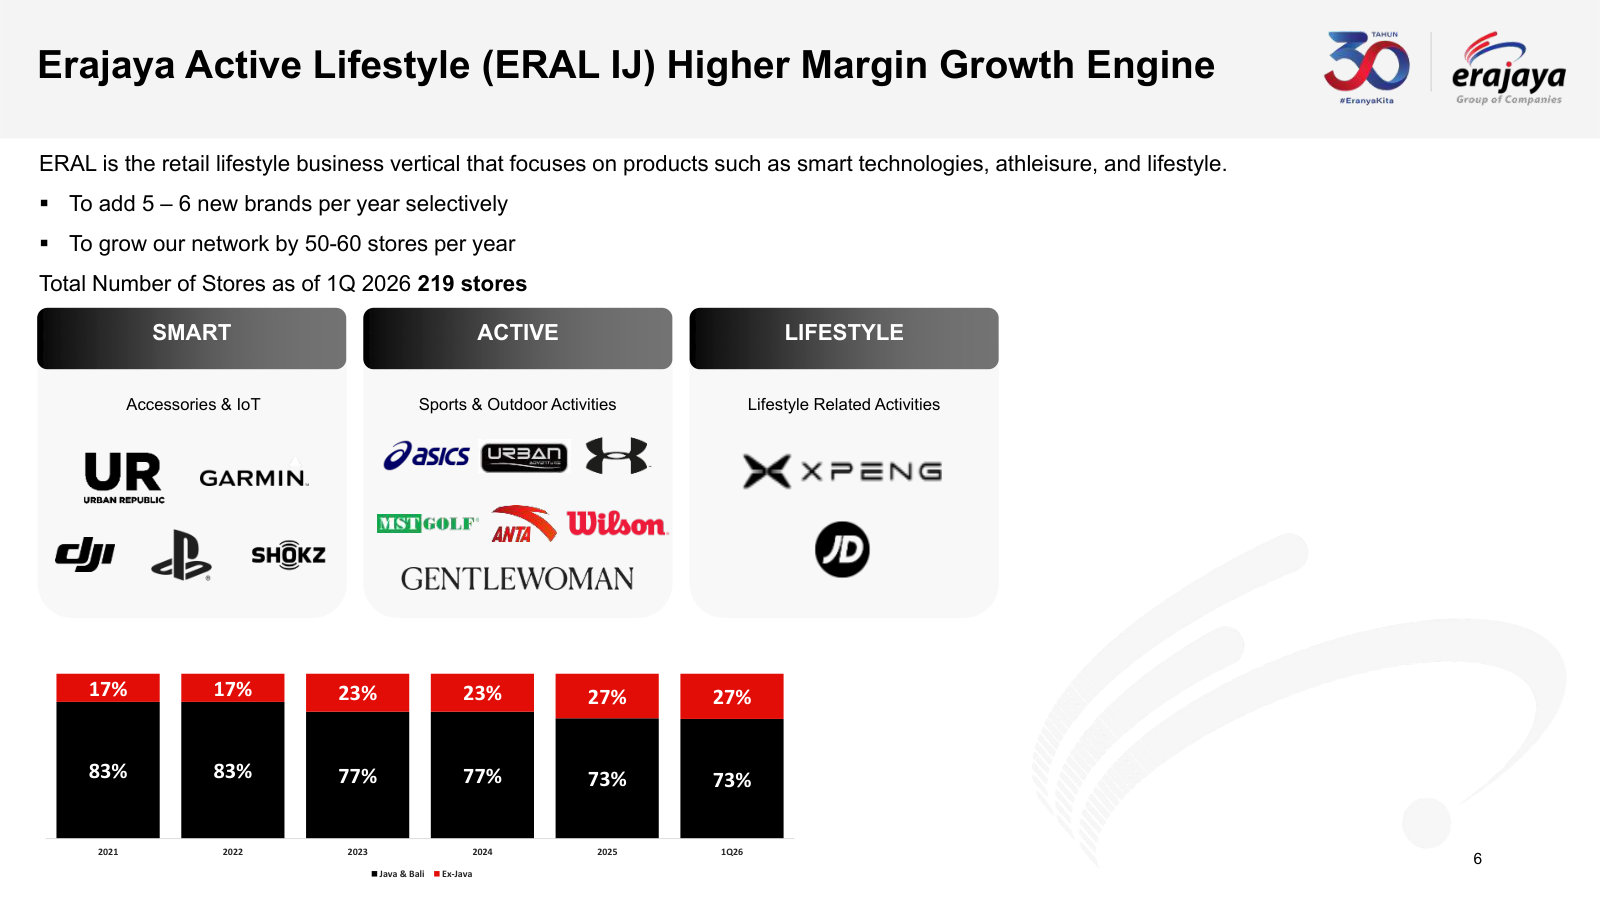
PT Erajaya Swasembada Tbk's management explains the business in its own materials. The slides below do the most of that work, pulled from the documents preserved in Sources. Each source link opens the complete presentation at that slide in a new tab.
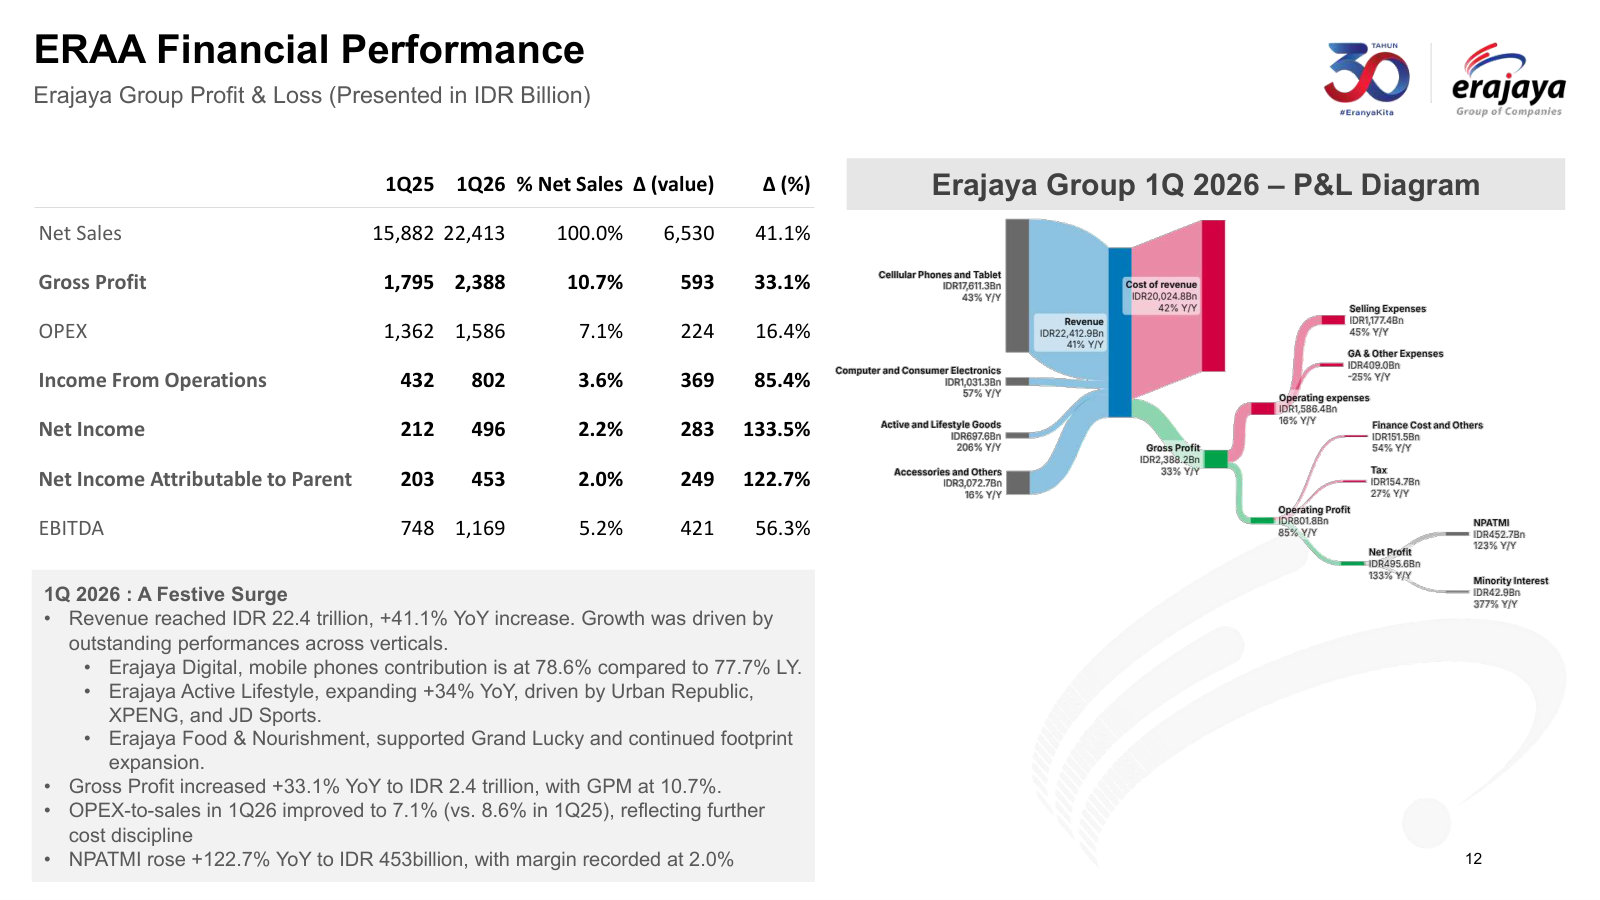
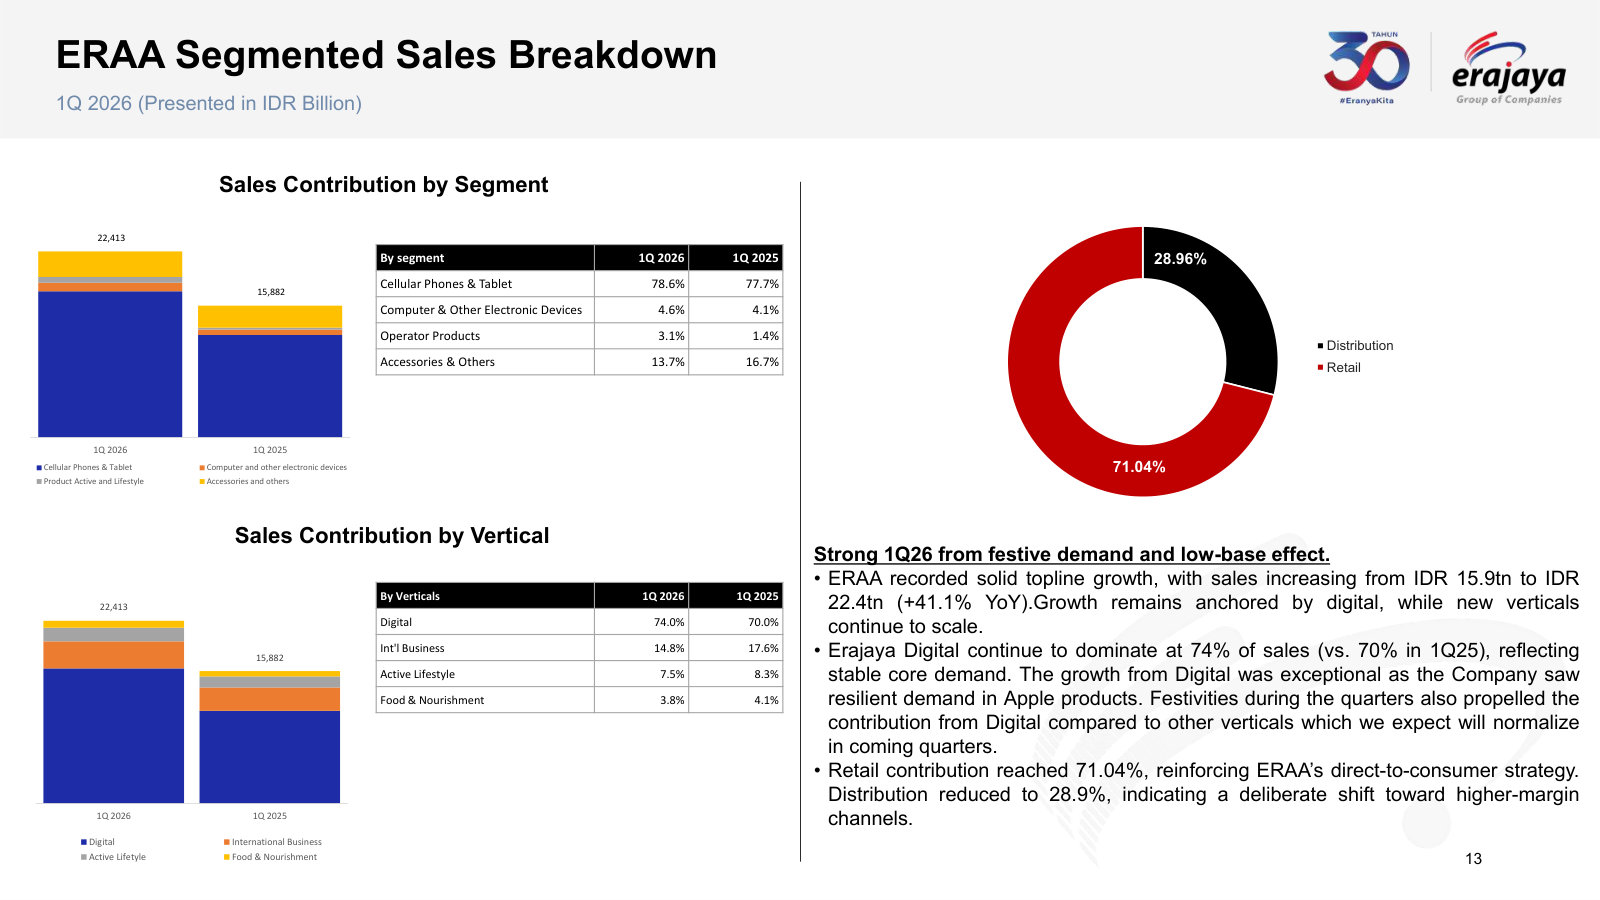
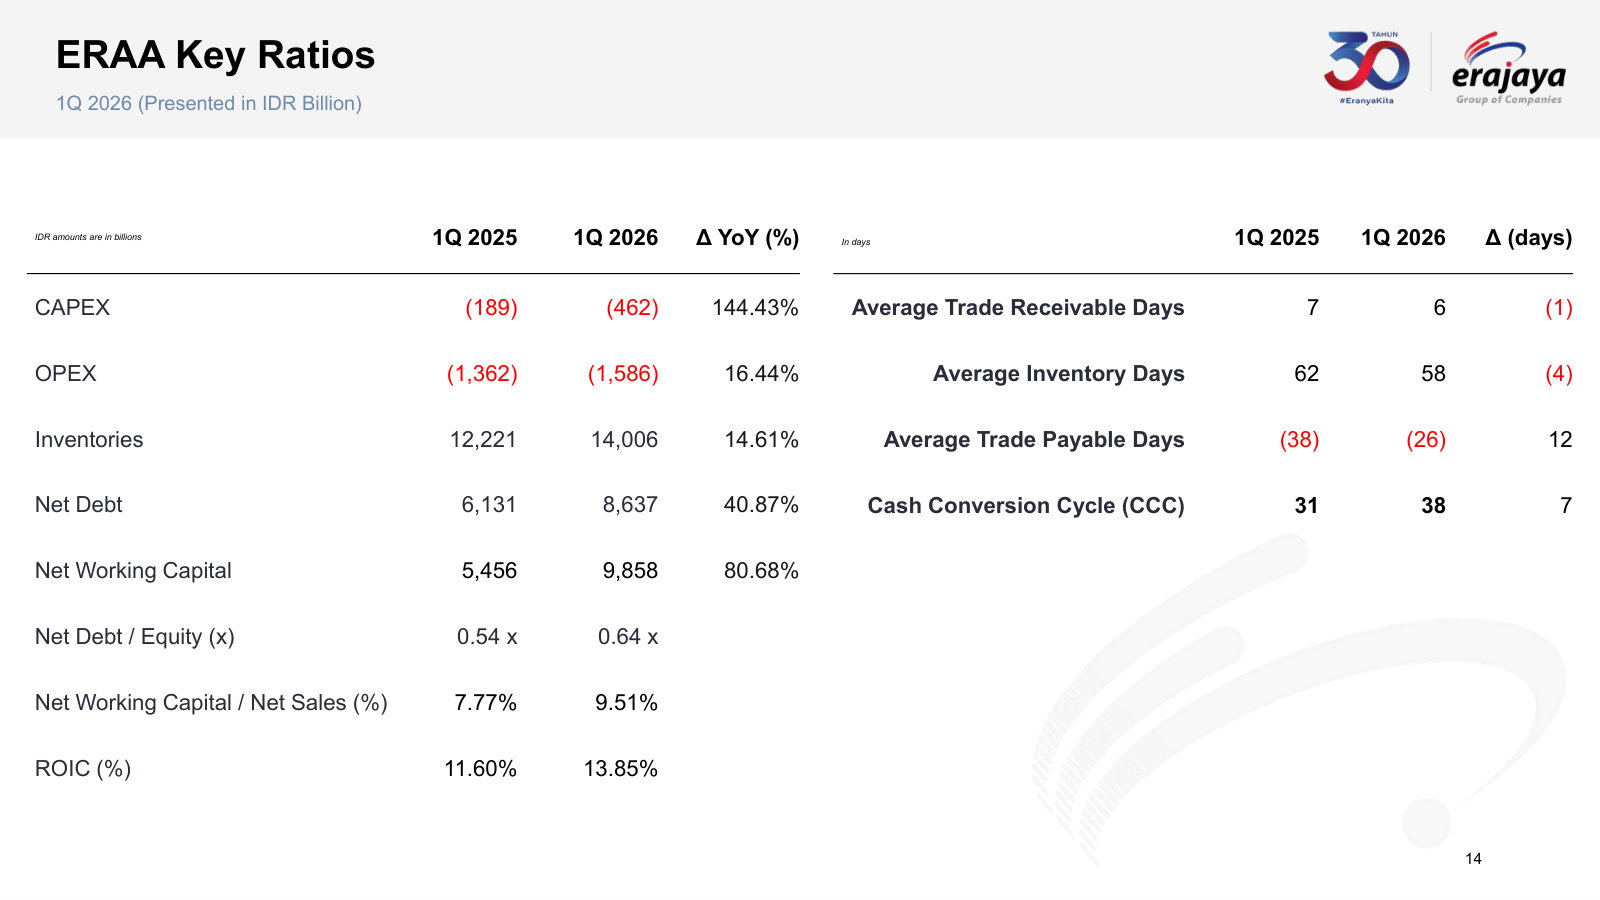
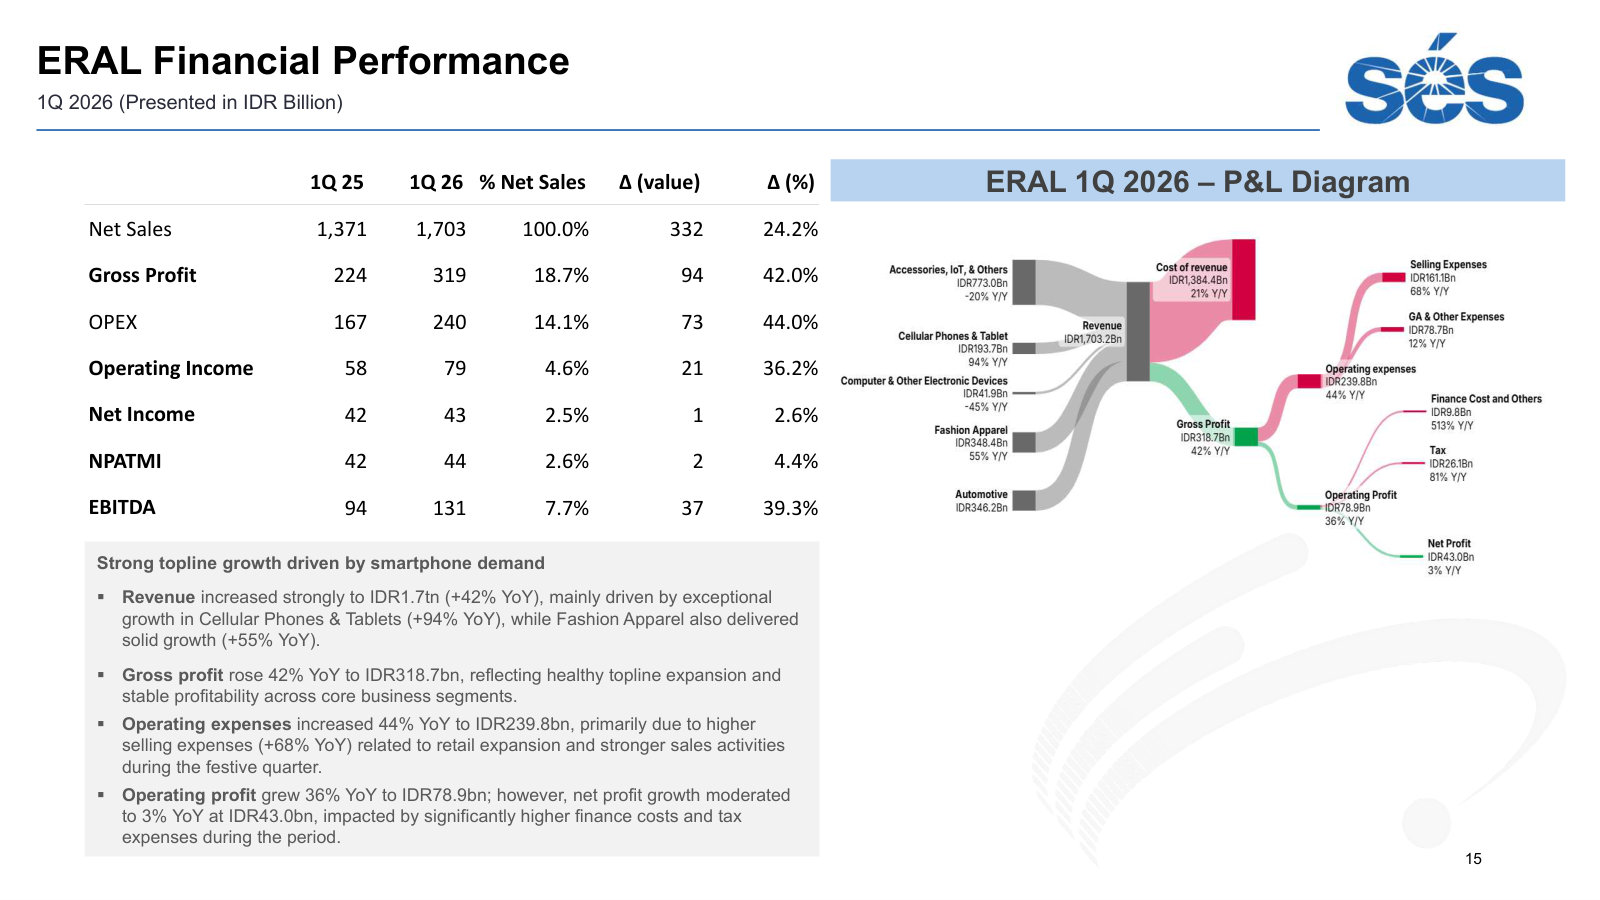
Company Update — 1Q 2026 Financial Statements — 1Q 2026
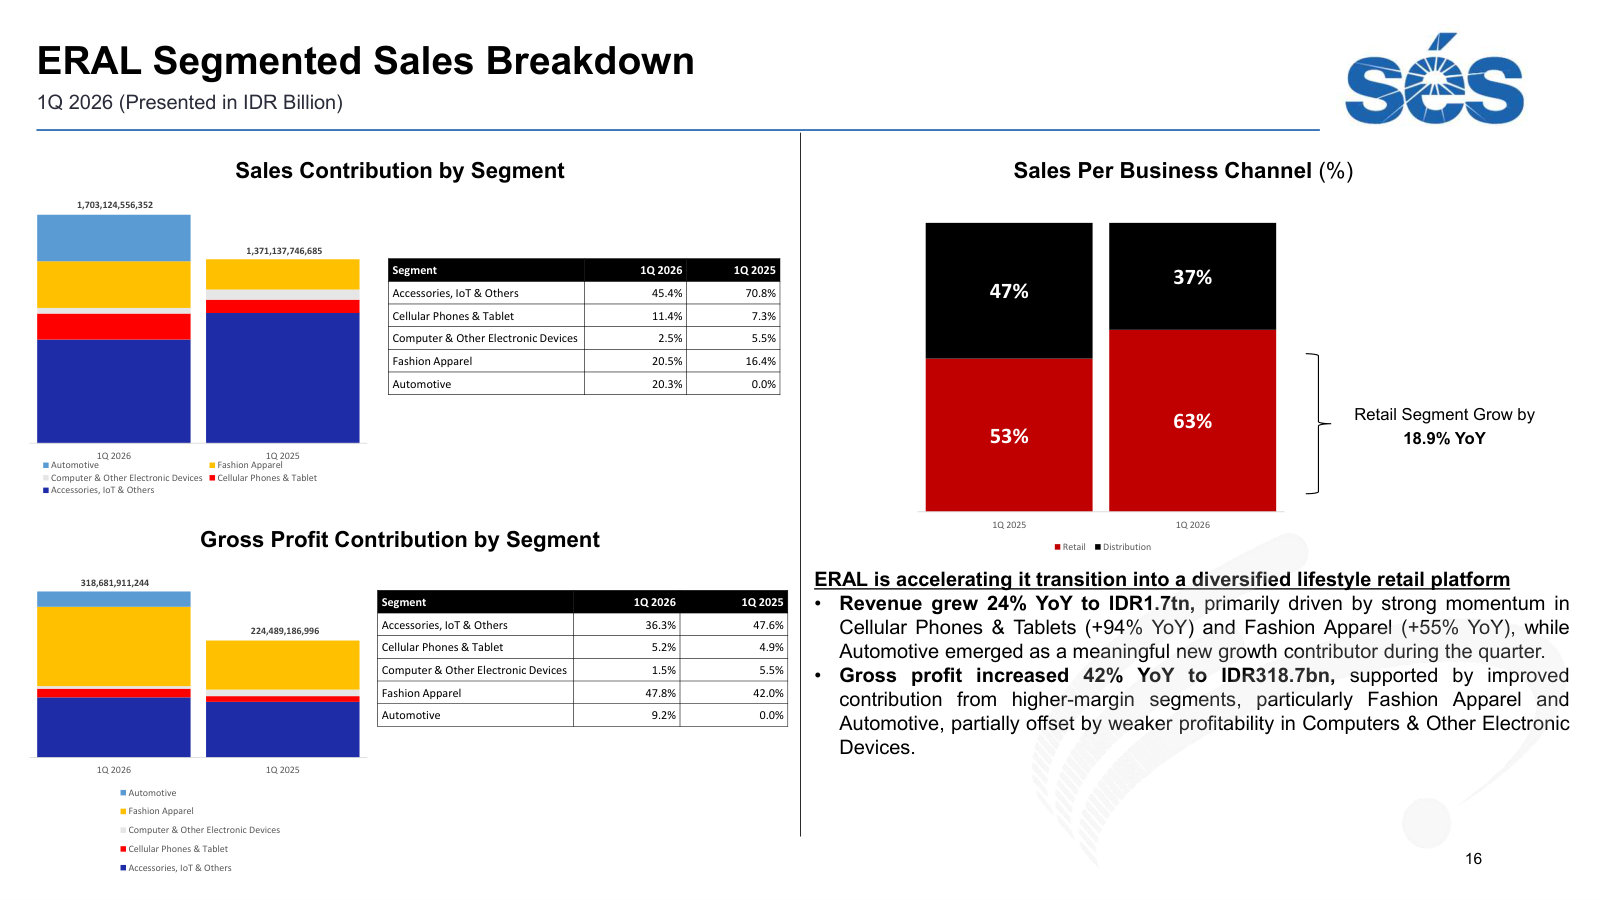
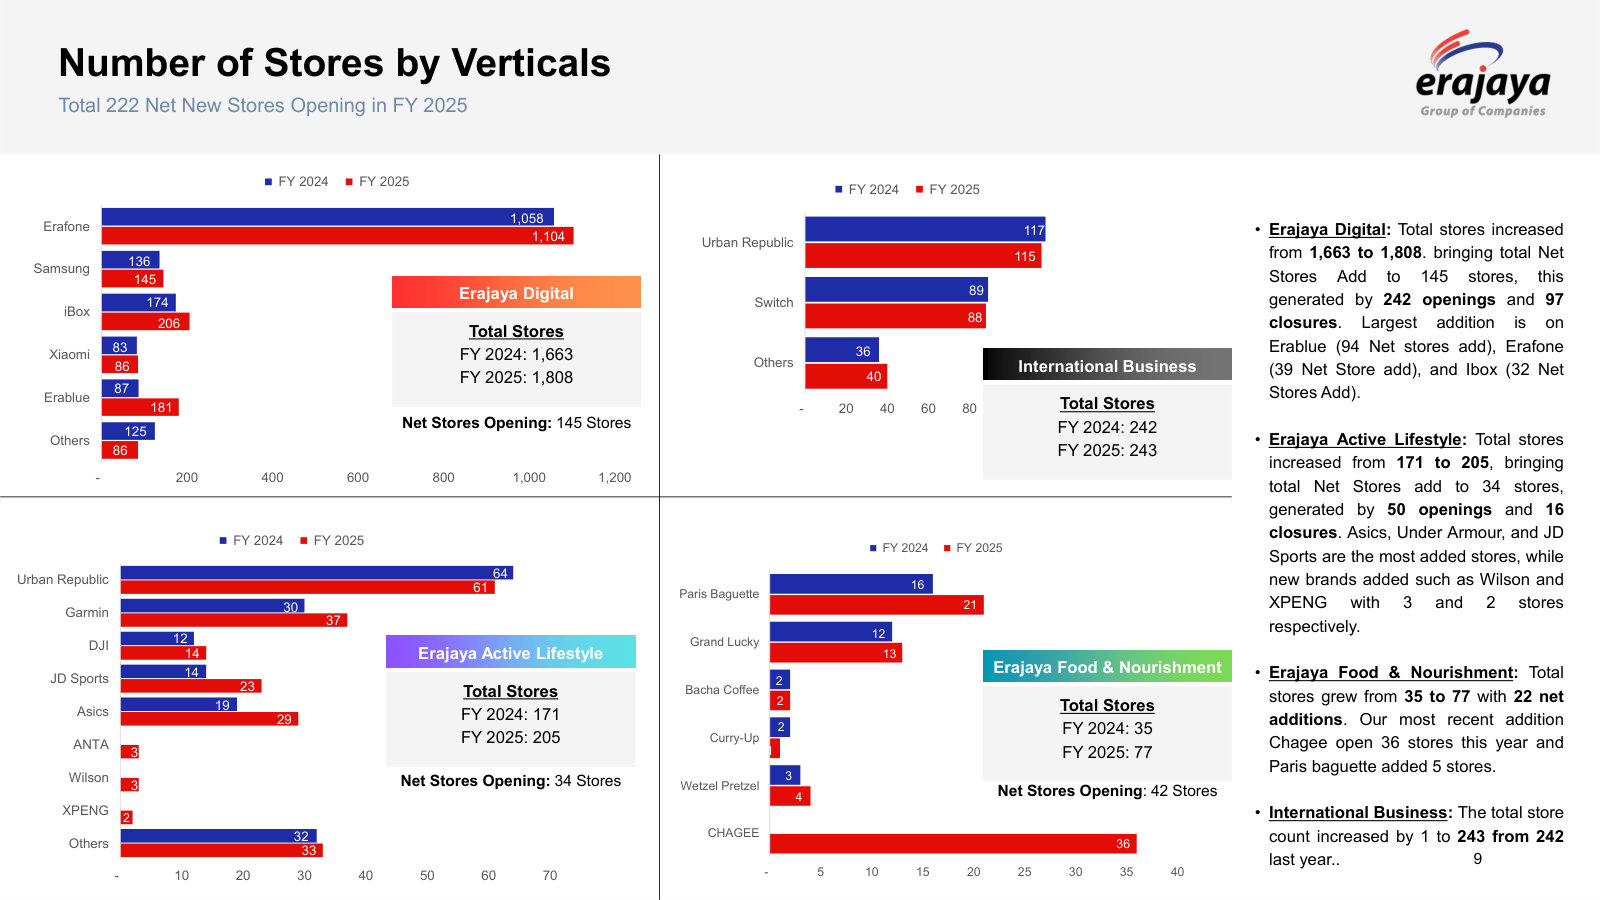
The current company update: what each vertical is, how the store network is built, and the latest P&L, segment mix and unit economics. · Open the full document →
Company Update — Audited Financial Statements FY2025 — FY 2025
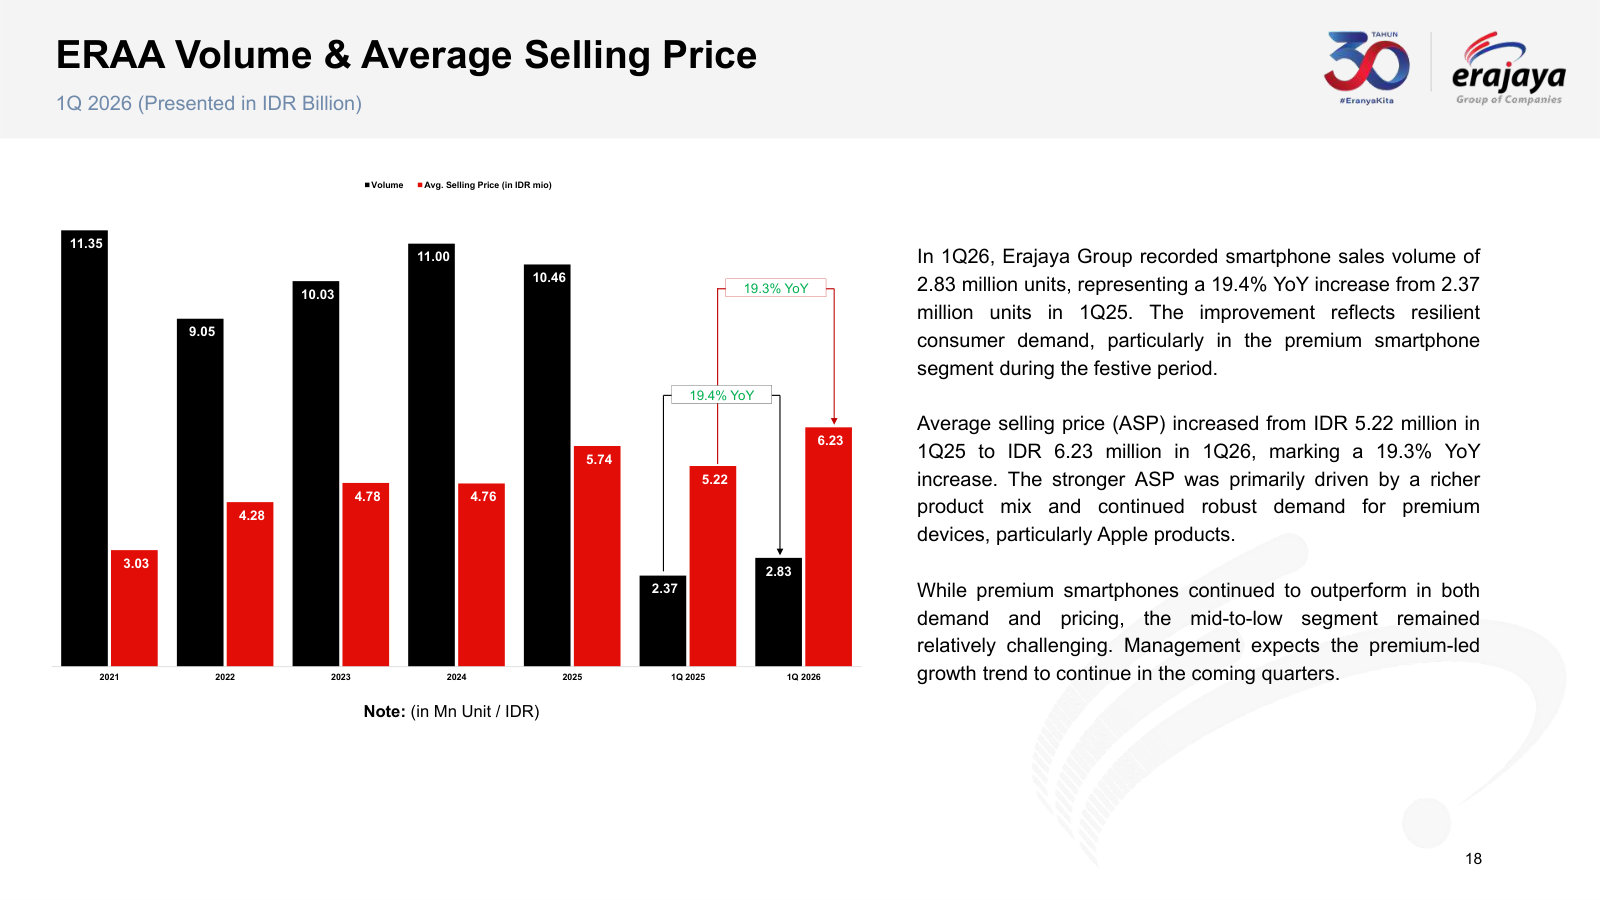
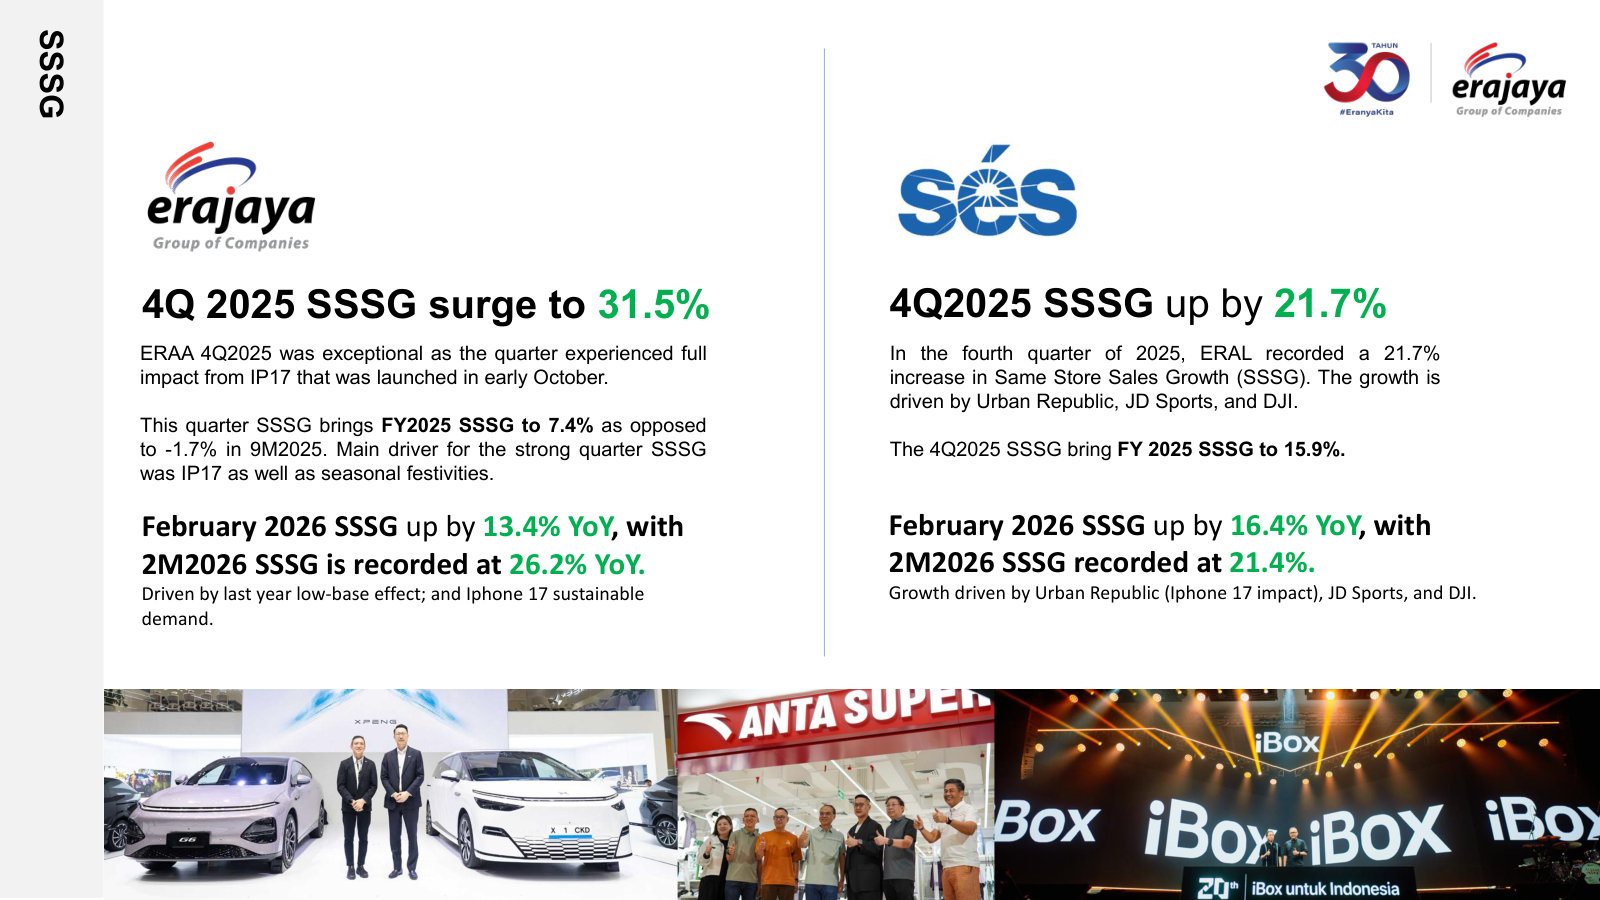
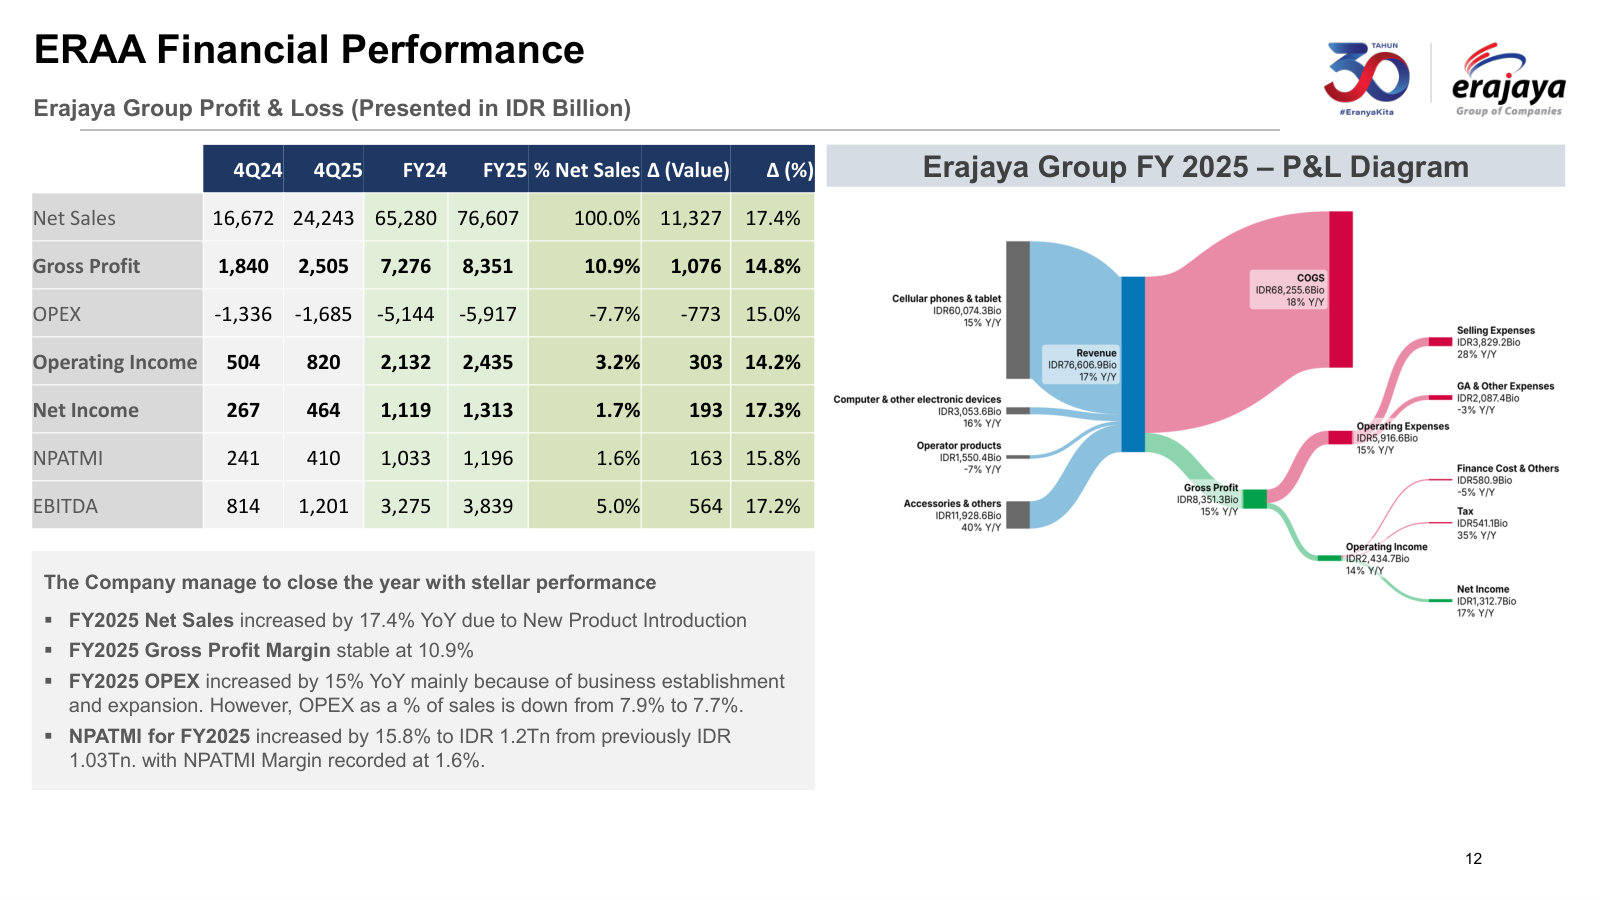
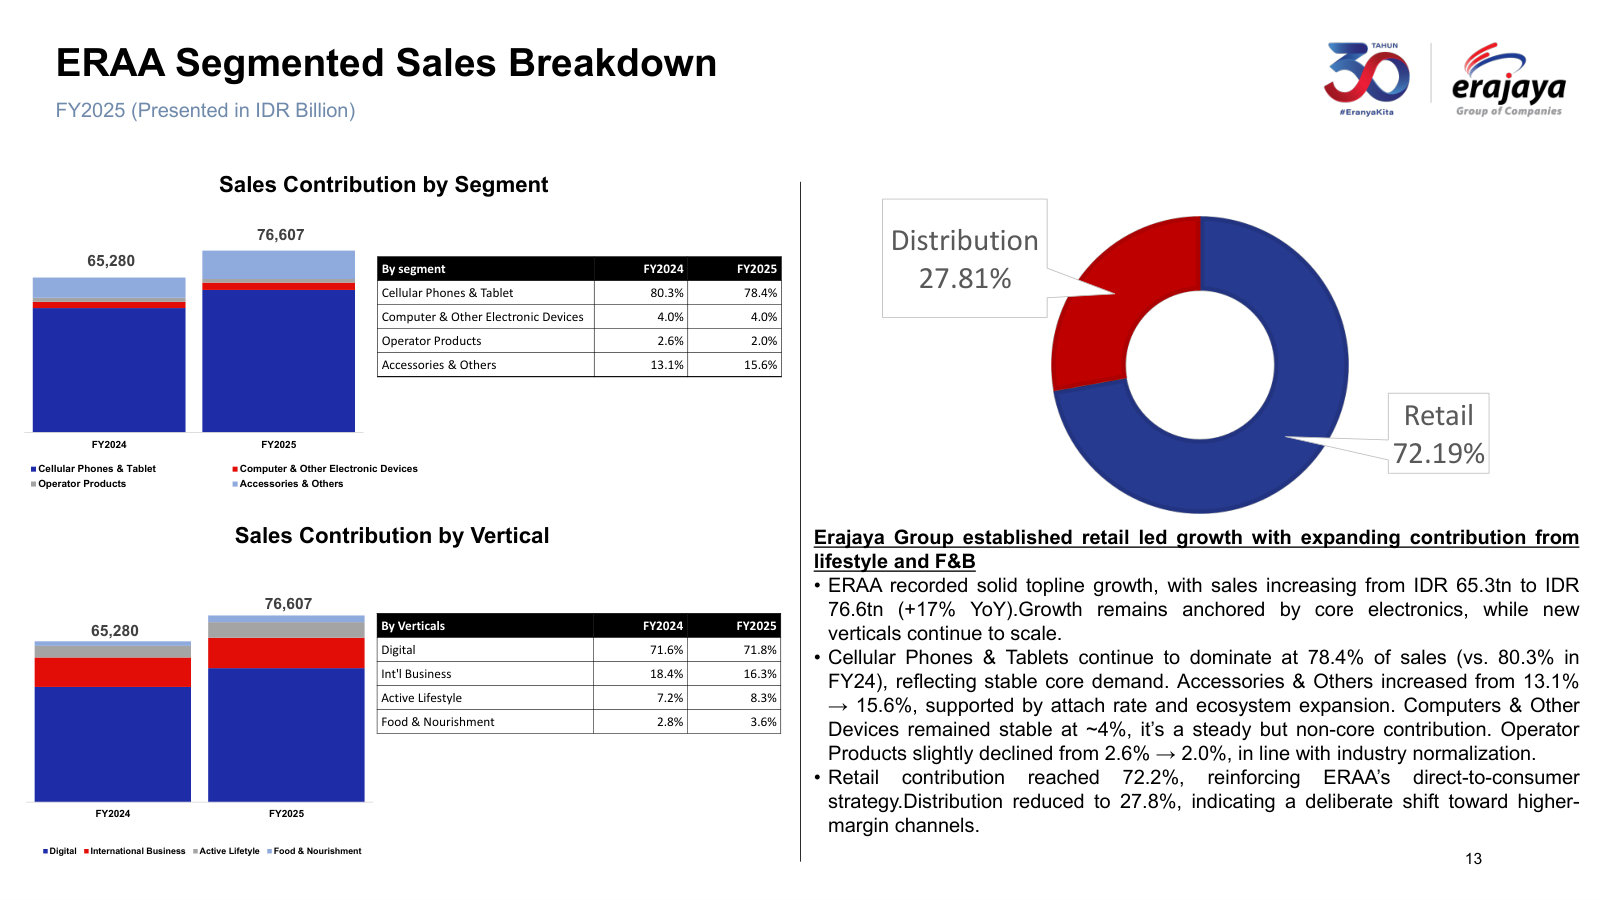
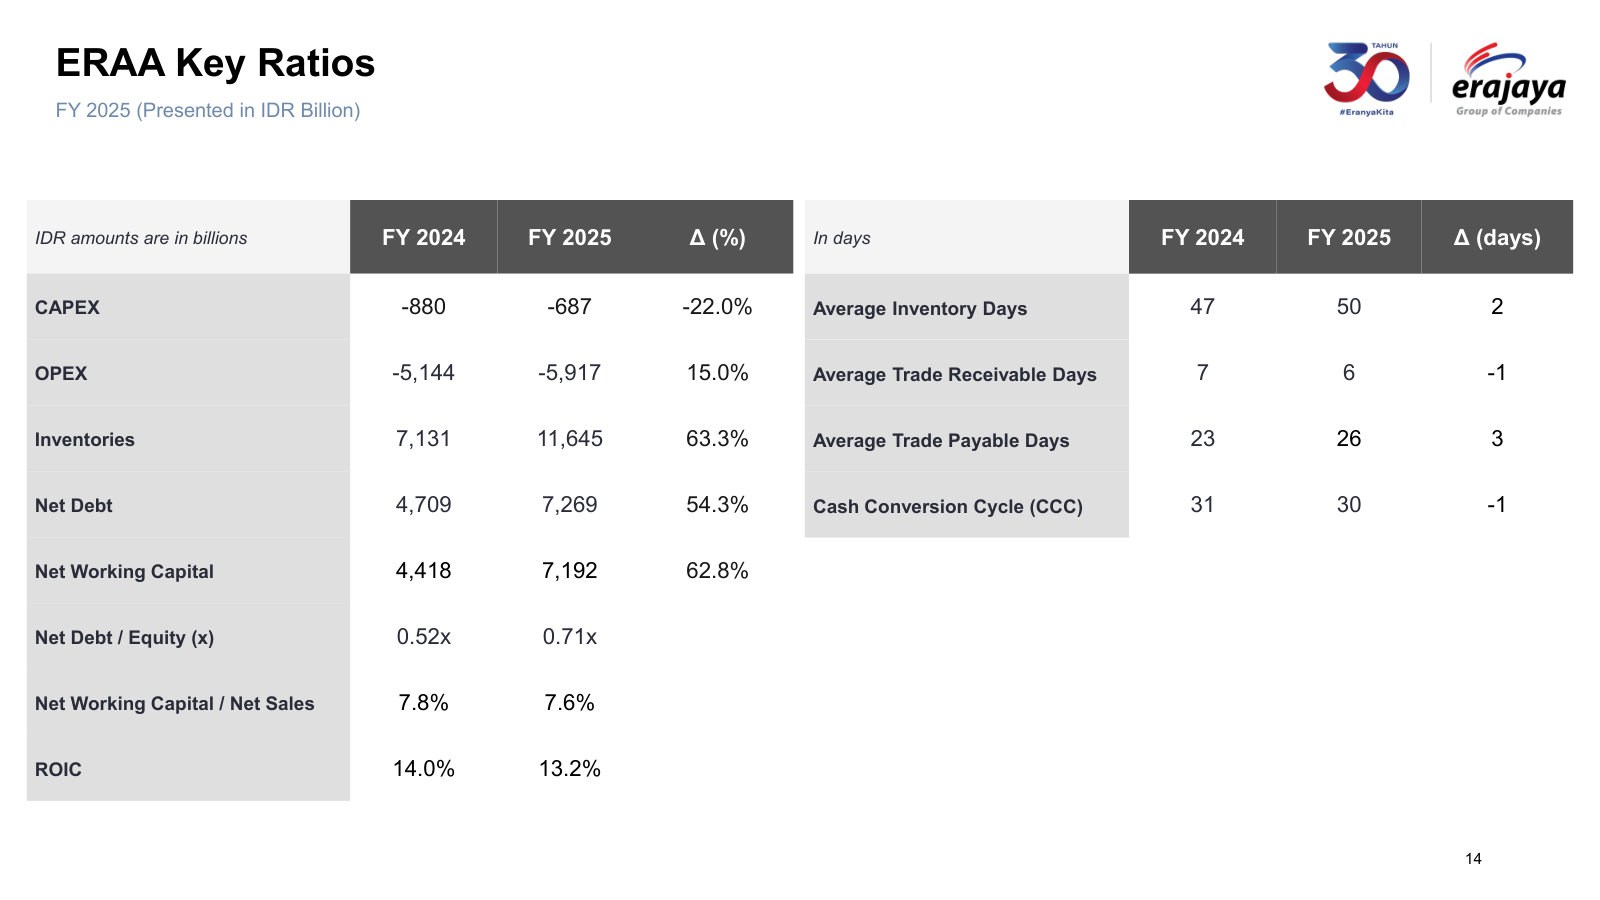
The audited full-year 2025 picture: annual P&L, segment mix, working capital and the volume-versus-price series at full-year scale. · Open the full document →
Company Update FY 2024 — FY 2024
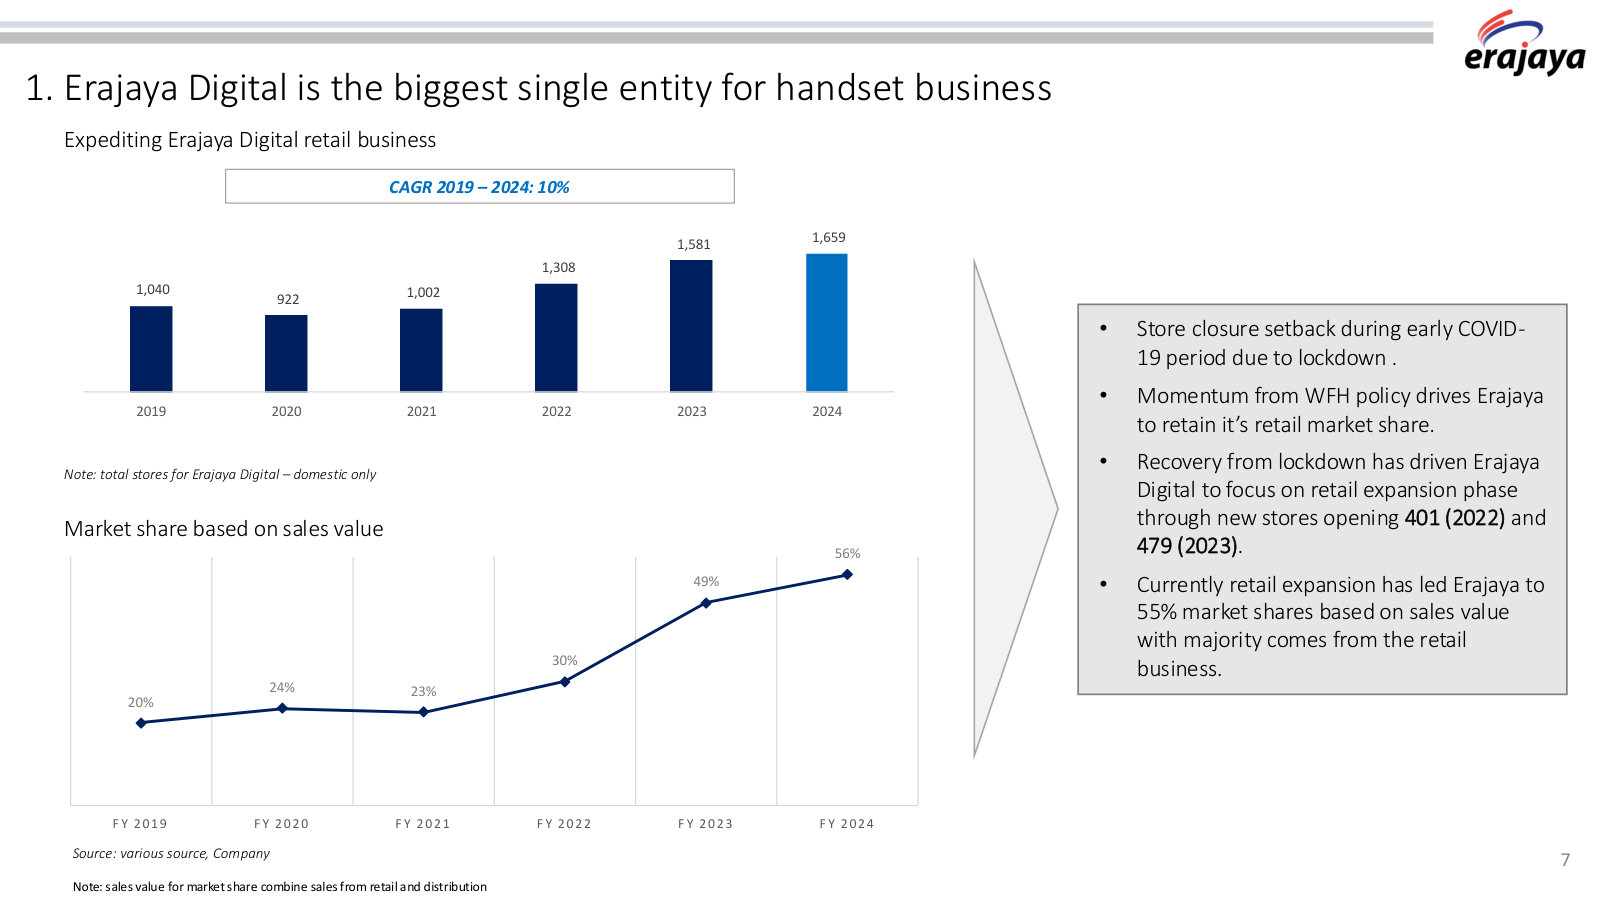
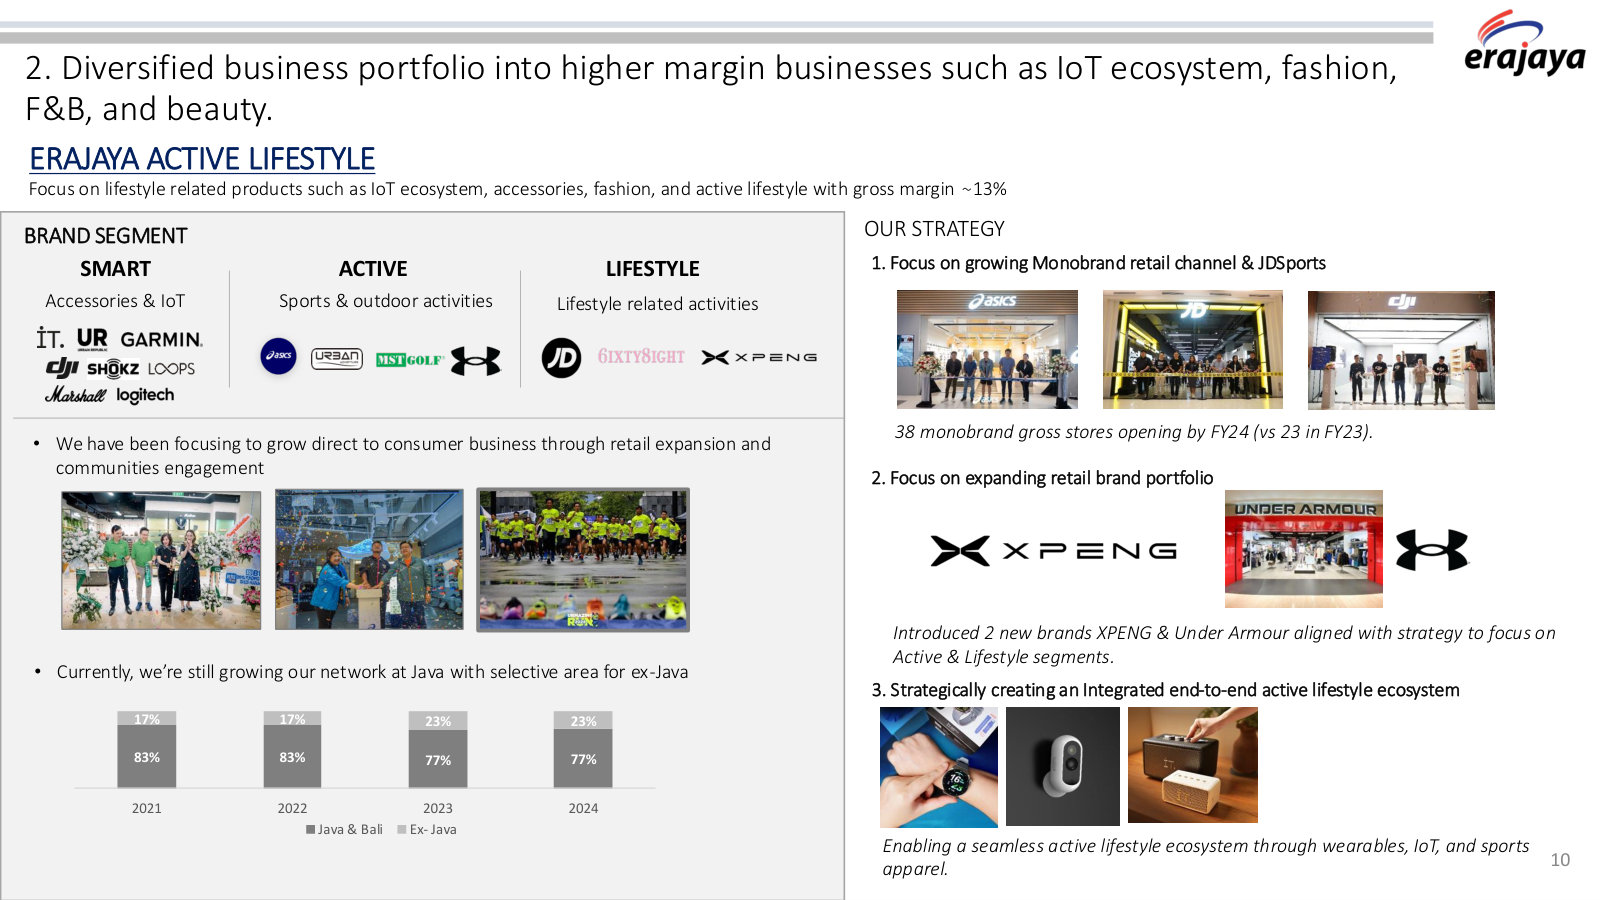
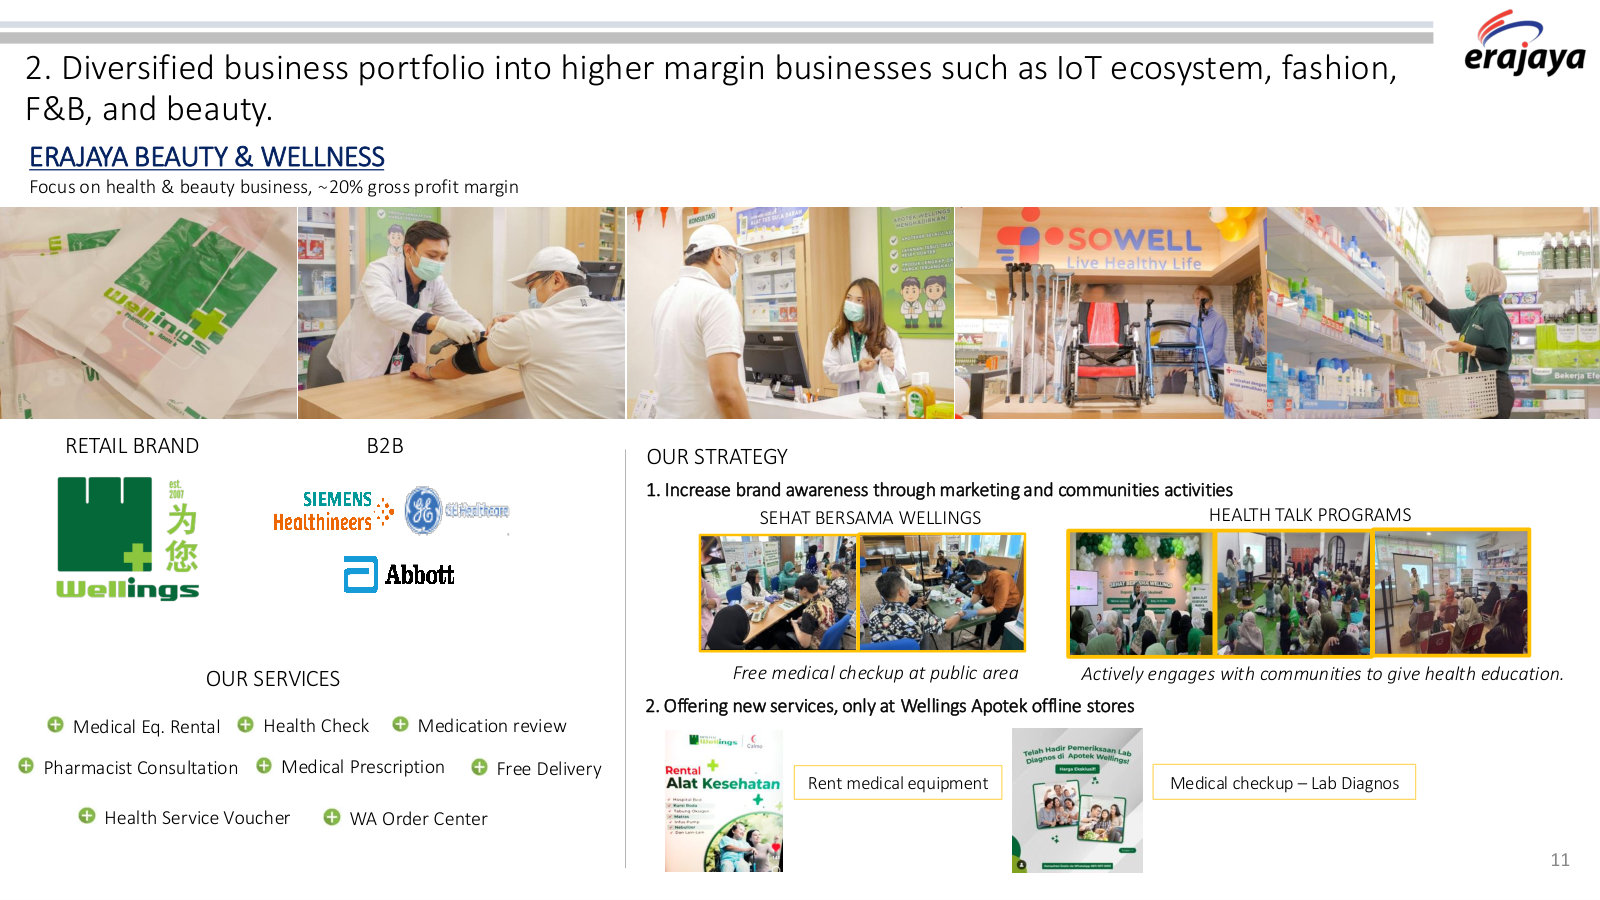
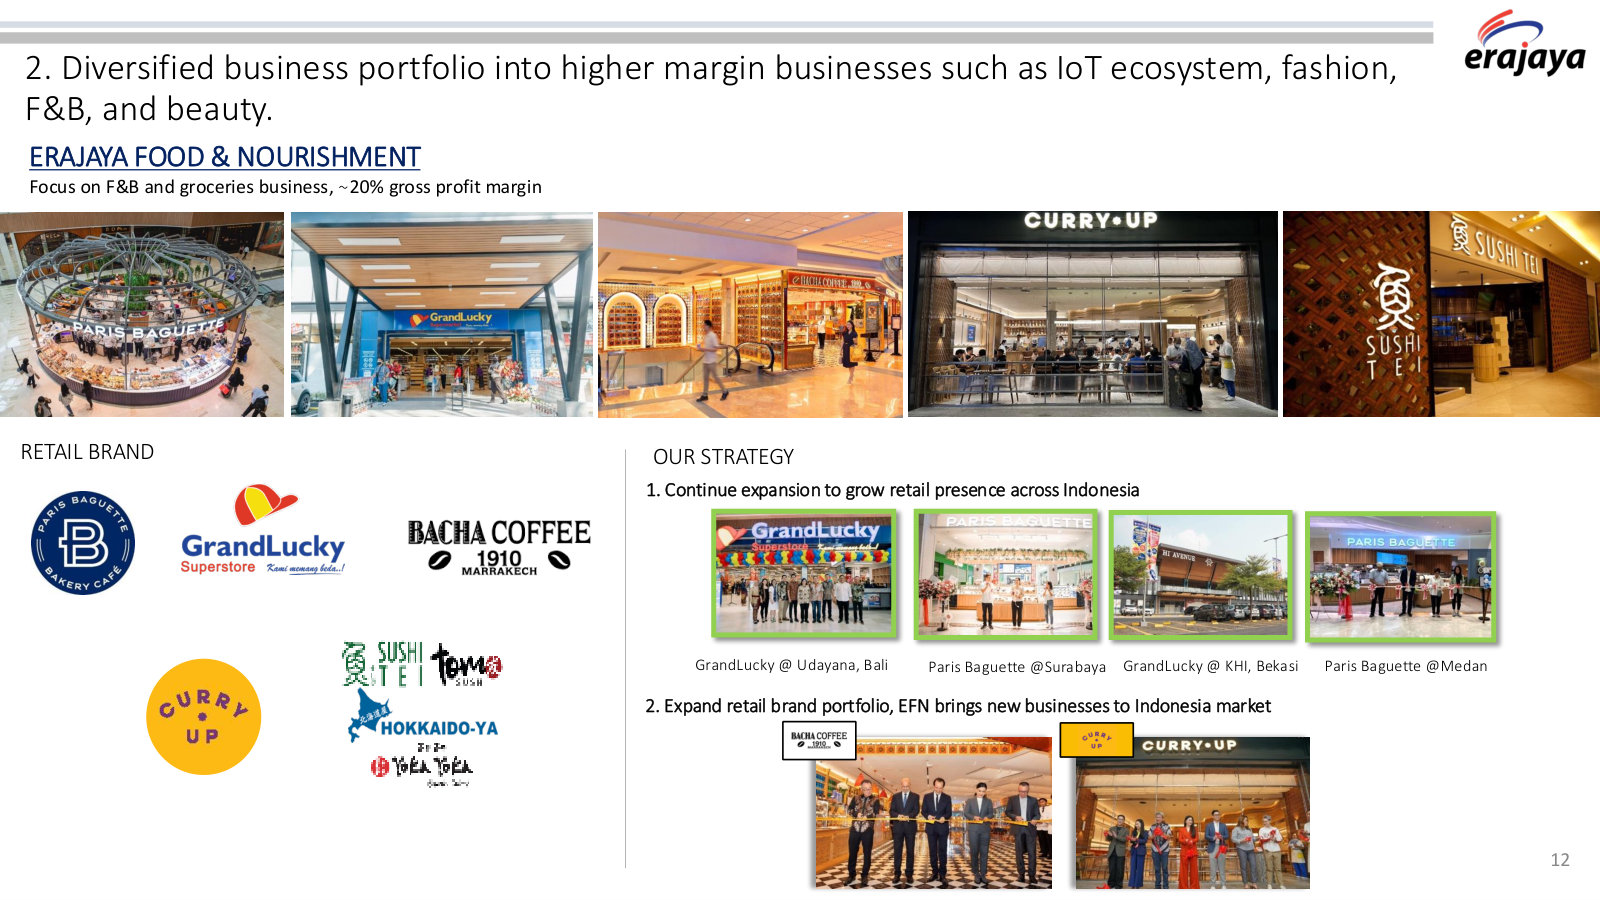
The last overview-style deck: company history, national footprint, the market-share record, and each vertical with its gross margin. · Open the full document →
More from management
Paparan Publik / Public Expose 2026 — 1Q 2026 · 15 pages · The annual IDX public expose, in Indonesian: the same 1Q26 numbers plus a group-at-a-glance page and the conservation and e-waste work. · Open →
Company Update — 9M 2025 — 9M 2025 · 22 pages · The deck just before the iPhone 17 quarter — the -1.7% same-store trough that the FY2025 rebound is measured against. · Open →
Corporate Presentation — 1H 2023 — 1H 2023 · 20 pages · The 2023 corporate deck: the ERAL subsidiary IPO rationale and valuation, and the Malaysia and Singapore store build-out in detail. · Open →
PT Erajaya Swasembada Tbk's annual reports contain management's most considered account of the business. These are the sections, passages and visual pages worth opening in the originals preserved in Sources.
PT Erajaya Swasembada Tbk — 2025 Annual Report (Laporan Tahunan) — FY2025
The latest full-year account: 2,333 outlets, Rp76.6tn of sales at a 10.9% gross margin, and the year operating cash flow nearly vanished. · Open the full document →
LAPORAN DIREKSI / REPORT OF THE BOARD OF DIRECTOR — p. 22 · Read the full section →
Management's own account of 2025 — where the 'Consciously Grow' stance came from and how a supplier's calendar moved the year.
The President Director on how Apple's launch calendar reshaped the sales year.
Beyond market-related challenges, Management also faced operational challenges associated with principal business dynamics. The rescheduling of Apple’s key product launches from October 2024 to April 2025 was managed through careful inventory oversight and proactive marketing strategies. As a result, by applying the principle of prudence the Company achieved a significant surge in sales growth during the first half of 2025 immediately after the products became available in the market. This demonstrates Erajaya’s capability to maintain growth momentum even amid shifts in the global product cycle.
p. 24 · Read in context →
SEKILAS TENTANG ERAJAYA / ERAJAYA AT GLANCE — p. 32 · Read the full section →
The business in its own words: an import-distribute-retail chain whose shelf space is rented from other people's brands.
Scale and the principal roster the whole model rests on.
As of December 31, 2025, Erajaya Group continues to expand its network and service reach, operating 2,333 outlets in various cities throughout Indonesia. To ensure service quality, the Company continues to develop strategic partnerships with well-known brands, including Apple, Asus, DJI, Garmin, Google, GoPro, Huawei, Infinix Nokia, Oppo, Realme, Samsung, Vivo, Xiaomi, Hono among others. Erajaya Group also collaborates with leading cellular network operators in Indonesia to distribute their products.
p. 32 · Read in context →
Three verticals in FY2025 — Beauty & Wellness, named in FY2024, is gone.
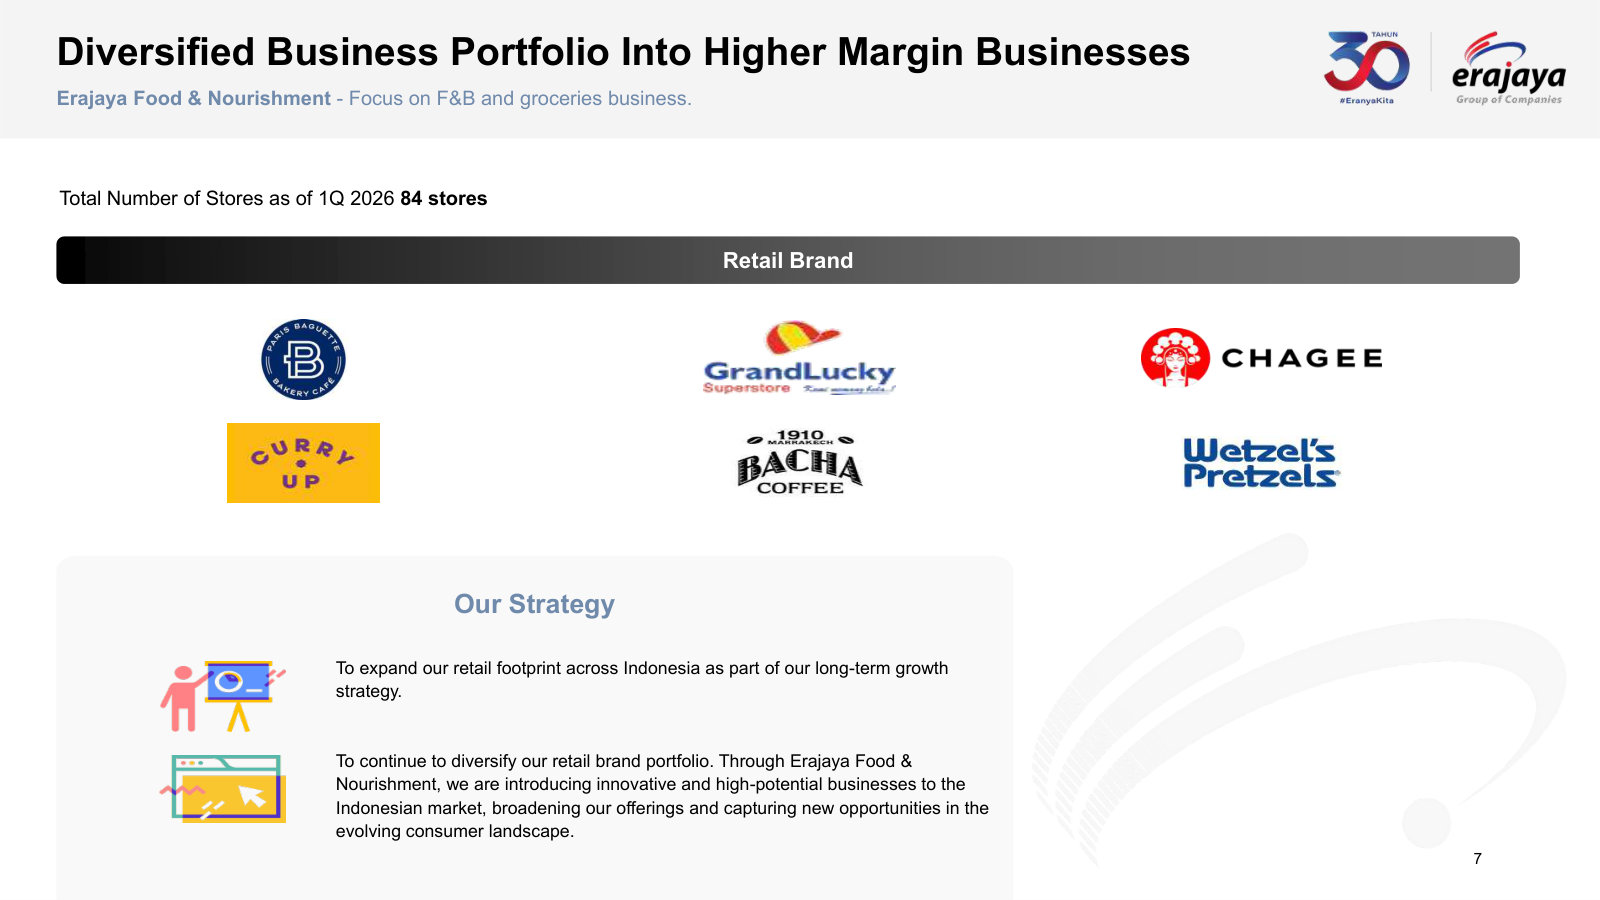
In addition to strengthening partnership strategies, the Company implements a customer-centric business strategy by actively expanding its business lines through vertical businesses: Erajaya Digital, which focuses on 3C products (Communication, Computers, and Consumer Electronics); Erajaya Active Lifestyle, which focuses on lifestyle-related products and accessories, including IoT devices, accessories, and sports fashion apparel; and Erajaya Food & Nourishment, which focuses on products in the Food, Beverages, & Supermarket sector.
p. 33 · Read in context →
BIDANG USAHA / LINE OF BUSINESS — p. 36 · Read the full section →
Where the newest diversifications are booked — XPENG electric vehicles and a drone-show operator, both outside consumer electronics.
Two 2025 additions to the line of business: EV distribution and drone shows.
The Company operates in the automotive industry sector, focusing on four-wheeled electric vehicles under the global XPENG brand in Indonesia. This business is conducted in collaboration with third parties and managed by PT Era Industri Otomotif. […] The Company also operates in the creative and advertising sector, focusing on the organization of drone show performances for promotional, event, and visual campaign purposes.
p. 38 · Read in context →
TINJAUAN INDUSTRI / INDUSTRY REVIEW — p. 67 · Read the full section →
The demand backdrop management is underwriting: premiumisation, GenAI handsets, and the regulatory gate that reopened iPhone sales.
Indonesia's 2025 handset market and the March 2025 TKDN clearance for the iPhone 16.
The Indonesian smartphone market in 2025 demonstrates strong resilience, with shipment volumes projected to exceed the 40 million unit threshold. This growth is driven by the acceleration of the “premiumization” trend and the massive adoption of Generative AI (GenAI) technology, which has now become the new standard for mid-to high-end devices. The shift in consumer preferences from mere hardware specifications toward AI functionality— such as real-time translation features and advanced digital assistants—provides significant added value to the digital retail ecosystem, particularly in boosting the average selling price (ASP) in the national market. […] experienced a significant rebound following the normalization of supply and the official sales approval of the iPhone 16 series in March 2025 after meeting the 40% Local Content Requirement (TKDN).
p. 67 · Read in context →
TINJAUAN OPERASIONAL / OPERATIONAL REVIEW — p. 69 · Read the full section →
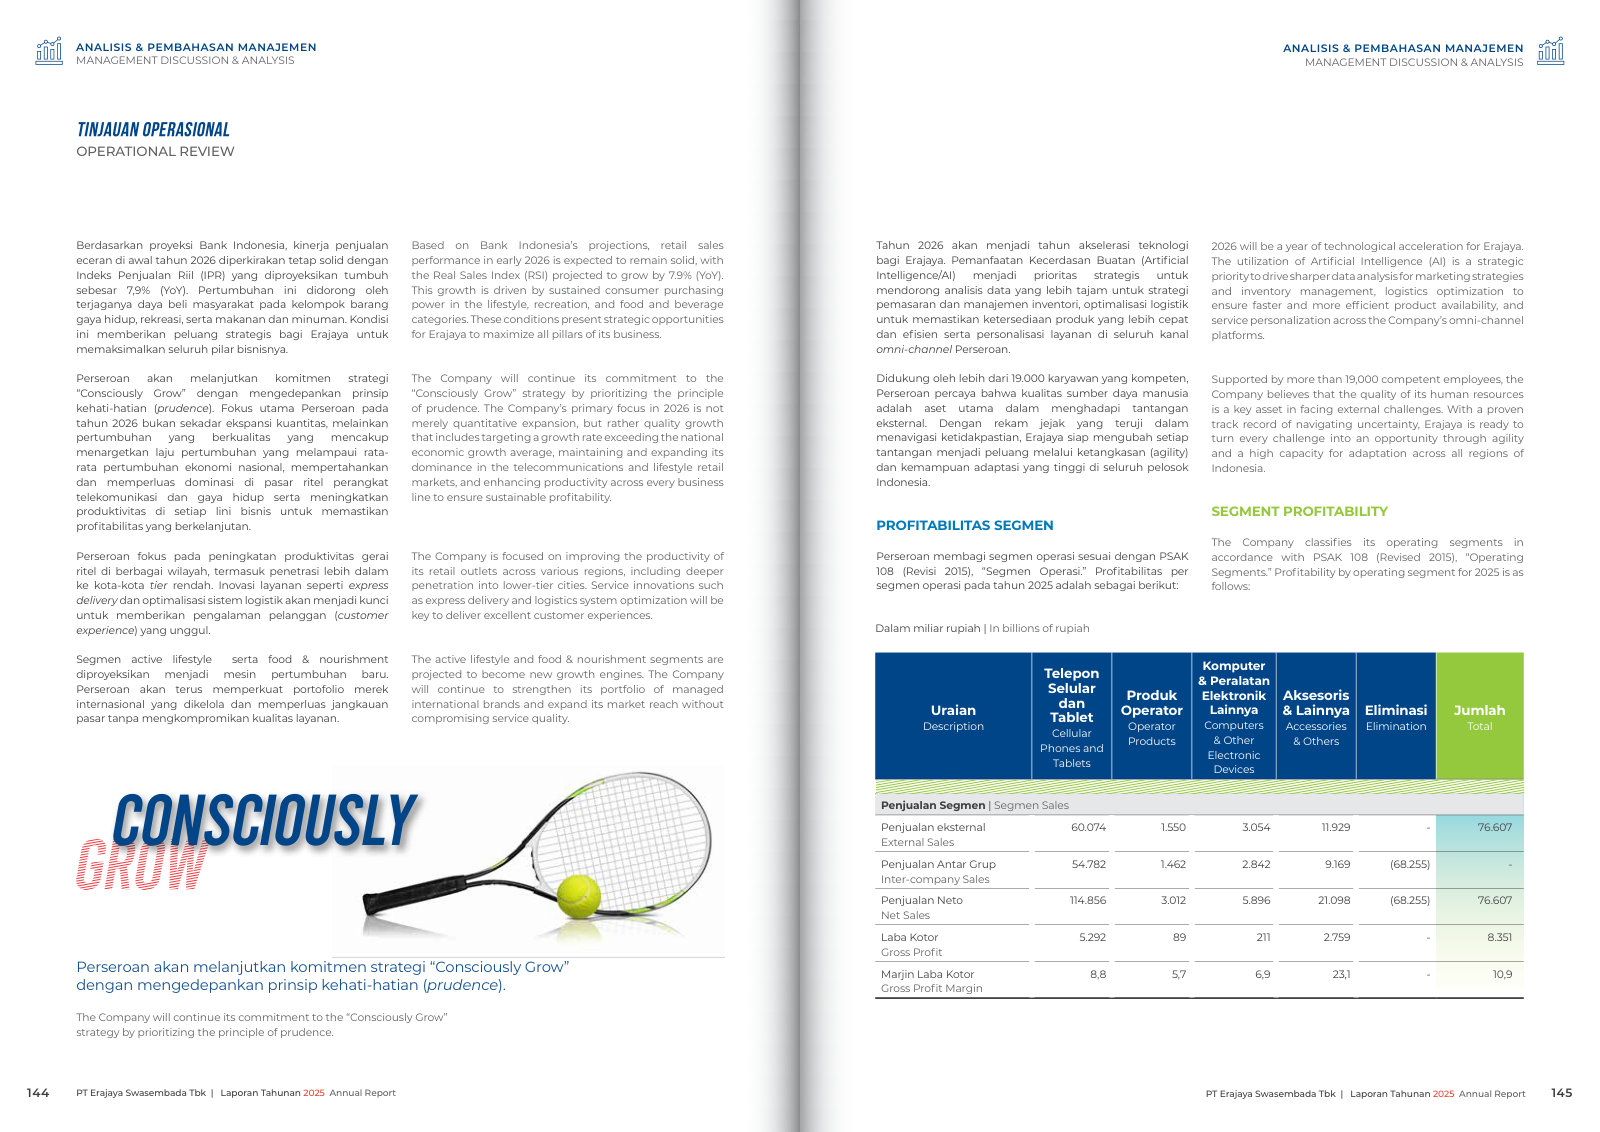
Where the money is actually made: banner-by-banner store counts, and the segment gross margins behind a 10.9% blended rate.
TINJAUAN KEUANGAN / FINANCIAL OVERVIEW — p. 75 · Read the full section →
The income statement walk — sales up 17.4% while selling and distribution costs rose 27.8%, compressing the gross margin.
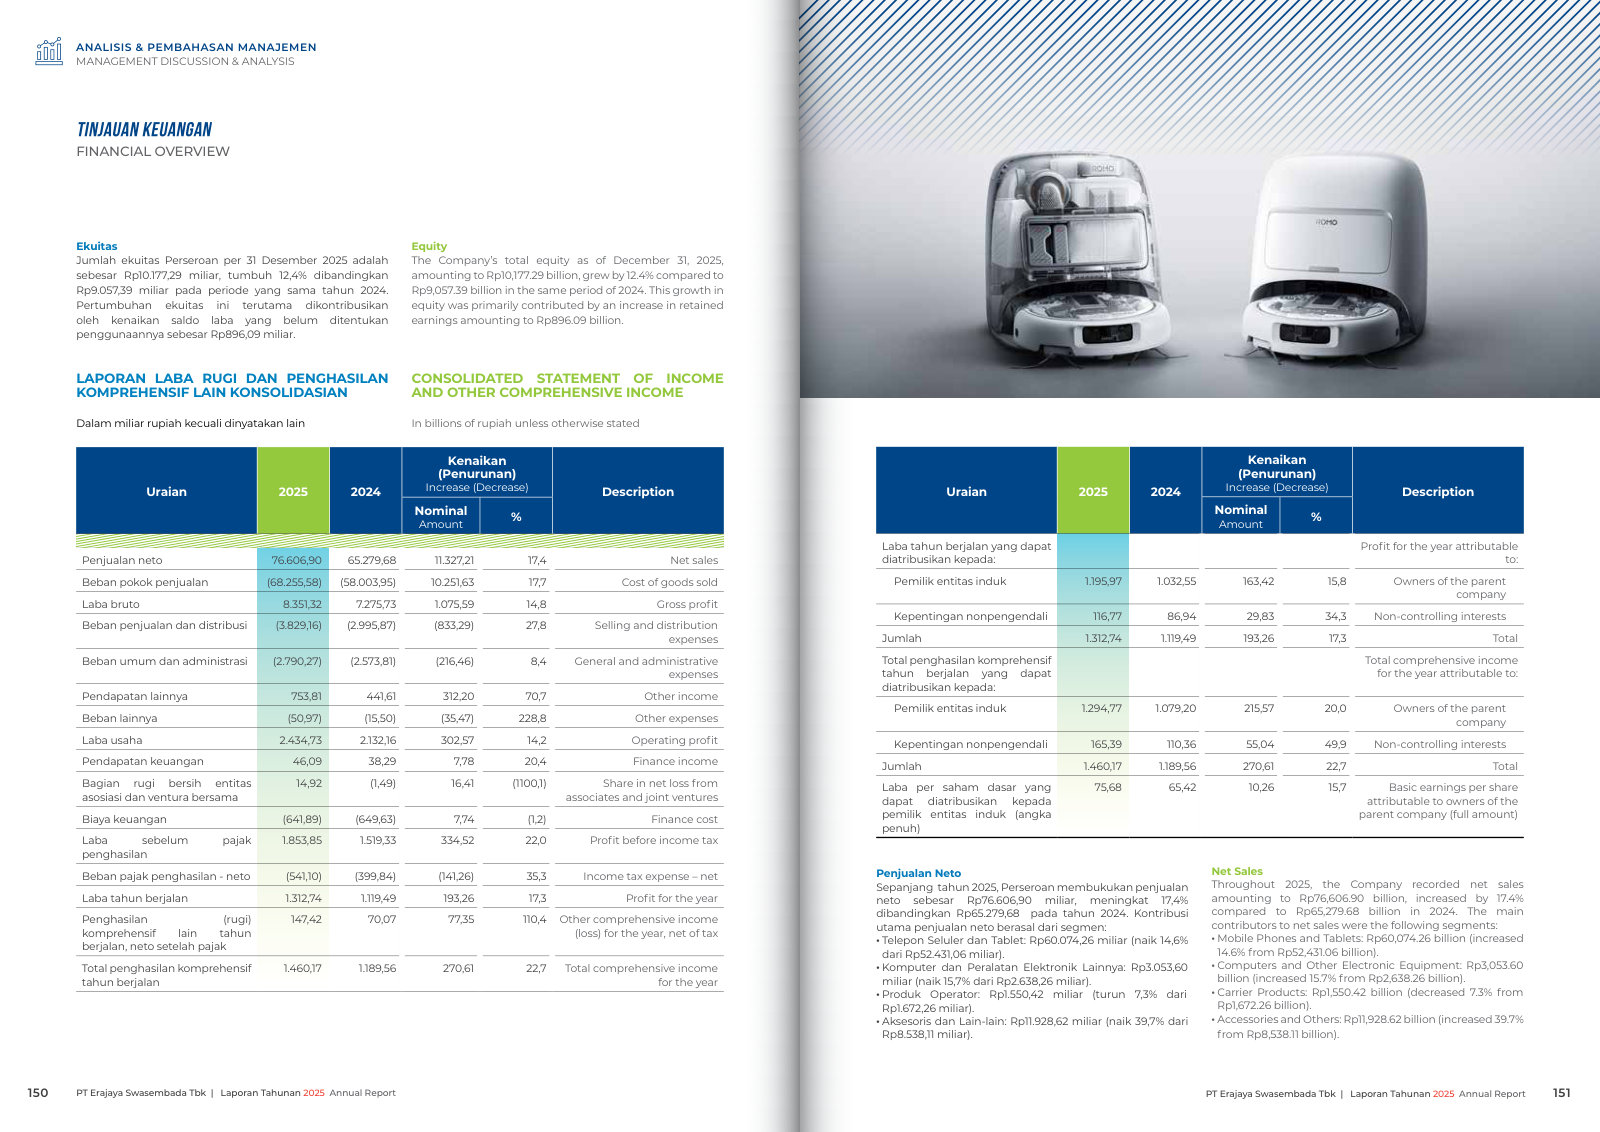
Selling and distribution expenses grew faster than sales.
Sales and distribution expenses increased by 27.8% from Rp2,995.87 billion to Rp3,829.16 billion. This increase was primarily caused by the increase of payroll expenses, depreciation of right-of-use assets, and advertising and promotional costs, which collectively increased by Rp586.28 billion or 30.3%.
p. 78 · Read in context →
LAPORAN ARUS KAS KONSOLIDASIAN / STATEMENT OF CONSOLIDATED CASH FLOWS — p. 78 · Read the full section →
The year's sharpest number: operating cash flow fell from Rp2,239bn to Rp225bn even as profit rose 17.3%.
Cash from customers rose Rp10.8tn; net operating cash flow fell 89.9%.
The Company recorded cash flows from operating activities consisting of cash receipts from customers amounting to Rp76,266.37 billion (2024: Rp65,461.88 billion). In addition, there were cash receipts from interest income amounting to Rp46.09 billion (2024: Rp38.29 billion). […] Meanwhile, cash used in operating activities consisted of cash payments to suppliers and employees totaling Rp74,945.44 billion.
Net cash provided by operating activities as of the end of 2025 amounting to Rp225.15 billion (2024: Rp2,239.32 billion).
p. 79 · Read in context →
KEMAMPUAN MEMBAYAR UTANG DAN TINGKAT KOLEKTABILITAS PIUTANG / SOLVENCY AND RECEIVABLES COLLECTIBILITY — p. 79 · Read the full section →
The balance-sheet cost of the expansion: current ratio down to 1.16x and debt-to-equity up from 1.40x to 1.84x.
Current liabilities outgrew current assets; the cash ratio fell to 0.12x.
The current ratio decreased from 1.22x in 2024 to 1.16x due to a 57.75% increase in current liabilities, while current assets increased by only 49.49% compared to the previous year. Meanwhile, the cash ratio decreased from 0.16x to 0.12x due to relatively stable cash and cash equivalents.
p. 79 · Read in context →
Leverage: liabilities up 46.88% against equity up 12.36%.
The debt-to-equity ratio stood at 1.84x, higher than 1.40x in 2024. Meanwhile, the debt-to-assets ratio was 0.65x, higher than 0.58x in the previous year. This increase occurred due to the increase in the Company’s liabilities by 46.88% and the increase in assets by 32.53%. Meanwhile, equity only increased by 12.36%.
p. 80 · Read in context →
SISTEM MANAJEMEN RISIKO / RISK MANAGEMENT SYSTEM — p. 128 · Read the full section →
Two risks specific to this importer: FX on stock bought in dollars, and import rules that can strand premium inventory.
FX on imported goods plus the 12% VAT step-up, and the IMEI/TKDN import regime.
Global economic uncertainty, which impacts fluctuations in the Rupiah exchange rate against the US Dollar, remains a key risk, considering that the majority of electronic products marketed are imported goods or contain cost components denominated in foreign currencies. In 2025, additional pressure arose from the potential decline in consumer purchasing power due to the adjustment of the Value Added Tax (VAT) rate to 12%, which began to be widely implemented. […] The Company operates within a dynamic regulatory framework, including policies on import trade procedures, IMEI registration, and Domestic Component Level (TKDN) requirements. Changes in import regulations (such as non-tariff restrictions) in 2025 may affect the availability of premium product inventory across the Company's retail network.
p. 128 · Read in context →
PT Erajaya Swasembada Tbk — 2024 Annual Report (Laporan Tahunan) — FY2024
Featured for one contrast: FY2024 describes four verticals and lists banners — Wellings, The Face Shop, Sushi Tei — absent from the FY2025 report. · Open the full document →
Tinjauan Operasional / Operational Review — p. 128 · Read the full section →
The portfolio as management framed it a year earlier, before Beauty & Wellness disappeared from the vertical structure.
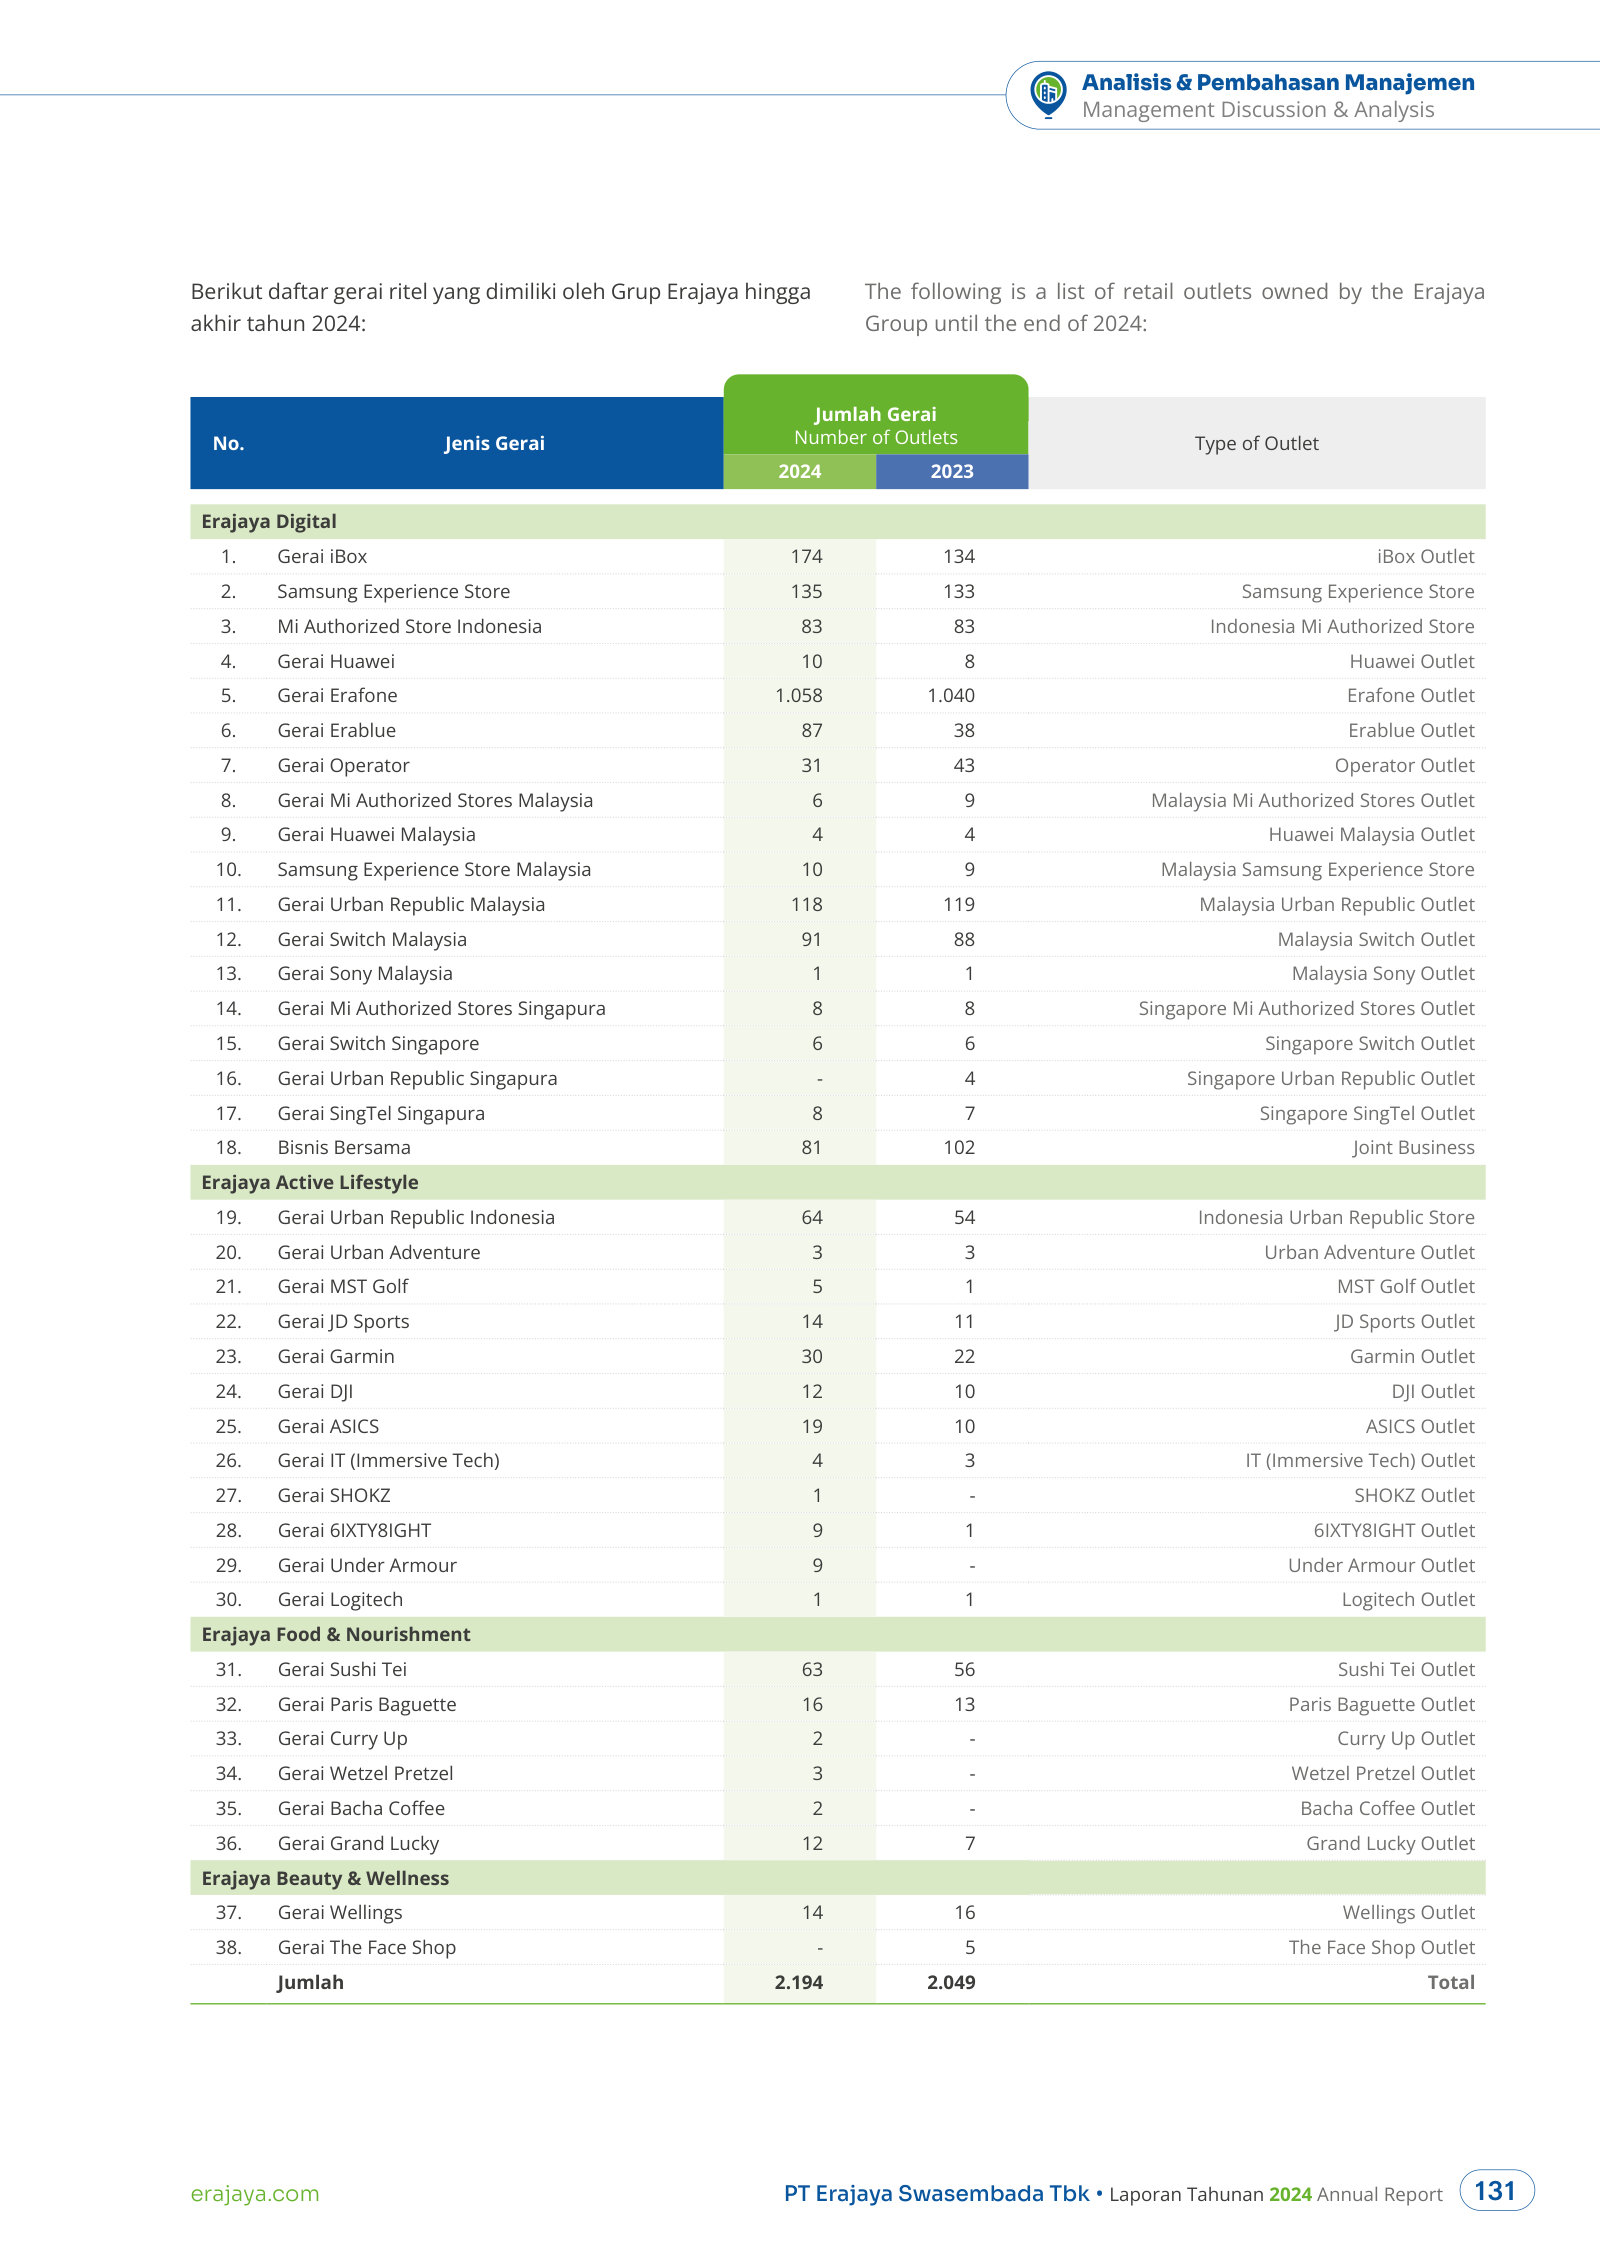
FY2024's pull-quote names four verticals, including Erajaya Beauty & Wellness.
“Erajaya Group engages in its business activities as importers, distributors, and retailers of telecommunication devices. By basing its business on customers, or “customercentric” business, the Company actively expands its business lines by opening new categories through 4 business verticals,namely: Erajaya Digital, Erajaya Beauty & Wellness,Erajaya Active Lifestyle, and Erajaya Food & Nourishment.”
p. 128 · Read in context →
More annual reports
PT Erajaya Swasembada Tbk — 2023 Annual Report (Laporan Tahunan) — FY2023 · 518 pages · Four verticals and 2,049 outlets: the year net sales grew 21.6% and subsidiary Sinar Eka Selaras was floated on the IDX as ERAL. · Open →
PT Erajaya Swasembada Tbk — 2022 Annual Report (Laporan Tahunan) — FY2022 · 526 pages · The four-vertical structure at Rp49.5tn of net sales — the base year for everything the 2025 report compares against. · Open →
PT Erajaya Swasembada Tbk — 2021 Annual Report (Laporan Tahunan) — FY2021 · 478 pages · The year the Active Lifestyle (JD Sports JV, August 2021) and Beauty & Wellness (Caring Pharmacy JV, November 2021) verticals were created. · Open →
Competitors describe PT Erajaya Swasembada Tbk's market in their own filings and calls. These verified passages and visual pages show where their strategies meet, using source documents preserved in Sources.
Senheng New Retail Berhad (5305)
The only peer in this run's corpus that filed a readable document, and a genuine competitor: Malaysia's largest listed specialist chain for consumer electrical and electronics goods, operating 116 stores under the Senheng, Grand Senheng and senQ banners. Erajaya's Malaysian subsidiary CG Computers Sdn. Bhd. ended 2025 with 223 outlets there — 115 Urban Republic, 86 Switch (Apple Authorised Reseller), 10 Samsung Experience Stores, 8 Mi and 4 Huawei — so the two chains sit in the same Malaysian malls and street-level locations. The overlap is sharpest in Senheng's senQ format, which the company describes as carrying "a wider range of digital gadgets and smart electronics, predominantly in shopping malls," the assortment Urban Republic and Switch sell; it is thinner in Senheng's white-goods and home-appliance core, where Erajaya's comparable format (Erablue, 181 Indonesian stores at end-2025 against 87 a year earlier) is a domestic rather than a Malaysian business. Exhibits below are confined to the retail-competition material — the corporate profile, MD&A and the risk discussion. Senheng's sustainability statement, governance chapters and AGM notices, which are the bulk of the report, are excluded. Senheng does not name Erajaya anywhere in the document.
How Senheng names its competitive set in a filed risk disclosure: brick-and-mortar retailers, online marketplaces and e-commerce platforms, in that order and with no single rival singled out. Erajaya's Malaysian stores fall in the first bucket; Shopee and Lazada are the unnamed second and third. The stated response is the one that matters for the subject, because it is the same lever Erajaya pulls — affordability through instalment and flexible-ownership schemes (Senang Milik) plus bank and credit-card financing partnerships, rather than headline price. Read alongside the demand statement above it, this is a peer arguing that the post-2022 normalisation in electronics demand is a return to trend rather than a cyclical trough, and that the contested ground is payment terms and access, not discounting. It is the peer's characterisation of its own market and is not independently verified here.
Management Discussion and Analysis — Risks, Challenges, and Mitigation Strategies: The observed moderation in consumer expenditure reflects a normalization of purchasing habits following the surge in demand for home appliances and consumer electronics experienced during 2020-2022. […] The retail industry operates with intense competition, with Senheng facing significant competition from an array of market participants, including brick-and-mortar retailers, online marketplaces, and e-commerce platforms. To sustain its competitive advantage within this environment, Senheng is prioritizing the delivery of appealing value through afordability and flexible ownership solutions, such as our Senang Milik program, designed to facilitate access to essential products. The Group also actively collaborates with a diverse range of financial institutions, such as major banks and credit card providers, to ofer a comprehensive suite of flexible payment solutions and financing schemes, with the aim of providing superior value, convenience, and exceptional service. […] The retail sector is undergoing rapid technological transformation, driven by changing consumer preferences and new technologies. The Group must continuously adapt and innovate its business model, digital platforms, and operational processes to maintain a competitive edge.
p. 17 · Read in context →
The most directly comparable disclosure in the document: Senheng withdrawing from the small-format, mobile-focused store concept — the format Erajaya's Malaysian arm is built on — while adding large experiential stores. The network shrank from 125 to 116 outlets over FY2024, with Senheng Mobile phased out through Q1 2025, six stores upgraded or relocated and three large-format stores opened. Senheng frames this as quality over quantity; the report also records the write-off of fixed assets on the Senheng Mobile closure as one of the charges behind FY2024 net profit falling to RM11.0 million from RM25.0 million (p.16), so the retreat carried a cost. Against this, Erajaya's Malaysian gadget formats moved the other way in aggregate over 2025 — Switch from 83 to 86 outlets and Samsung Experience Stores from 9 to 10, with Urban Republic edging down from 117 to 115. The online figure is the other half of the picture: RM128.3 million, up 54%, but still only about a tenth of the group's RM1,216.9 million revenue, so this is a chain whose e-commerce is growing fast off a small base while its store count contracts.
Management Discussion and Analysis — Fortifying Omnichannel Leadership and Accelerating Digital Growth: In FY2024, we recalibrated our store portfolio, aligning with our focus on innovation, agility, and efective resource allocation. We took several key actions: closure of Senheng Mobile stores to right-size our earlier growth initiative involving small-format mobile-focused brand operation, phased out from FY2024 to the first quarter of 2025; upgrades or relocations of six existing stores; and opening of three new Grand Senheng, Grand Senheng Elite, and senQ stores. Our optimized network stood at 116 stores as at 31 December 2024 (compared to 125 at the end of 2023). […] Our eforts on boosting online market penetration yielded robust online sales growth, reaching RM128.3 million in FY2024, a 54% increase from RM83.5 million in the previous year, underscoring the efectiveness of our digital strategy.
p. 15 · Read in context →
Figures converted from Indonesian rupiah at historical FX rates — see data/company.json.fx_rates. Ratios, margins, and multiples are unitless and unchanged.
What the profit became
Between FY2021 and FY2025 Erajaya reported $352 million of profit but converted it into only $13 million of free cash flow ($239 million operating cash against $226 million of capex, before $51.5 million of FY2025 lease payments), because the growth was consumed by a $193.2 million Article-22 tax-refund block that in H1 2026 fell just $6.3 million even as $77.0 million was collected, and by a $686 million inventory whose FY2025 gross build of $273 million — 90% handsets — was roughly 3.4 times the $71.8 million earned for owners that year [1] [2] [3] [4] [5] [6].
That is a conversion rate of 4.6% — $13 million of free cash against $352 million of reported profit. At 0.65 times book [7] the discount is earned only if the two capital sinks behind the gap, the tax-refund block and the inventory, release cash rather than scaling further with sales. The strongest evidence that they can is the most recent: in the six months to June 2026 operating cash flow swung to a positive $102.5 million [8], which repaid $75.7 million of bank debt and redeemed $37.9 million of bonds [9] while the FY2025 phone build sold through. Two consecutive years in which operating cash after lease payments covers capital expenditure and the dividend would settle it in the company's favour; a repeat of 2025's inventory build funded by short-term bank lines would settle it the other way.
What Erajaya is
PT Erajaya Swasembada Tbk sold $4.60 billion of goods in 2025 and kept $71.8 million for its owners — 1.6 cents of every dollar [10]. It is a leading Indonesian importer, distributor and retailer of mobile devices — it runs the country's largest official Apple retail network [11] — now extending into sportswear, groceries and bubble tea. The market values the whole business at about $339 million, roughly four times trailing earnings and two-thirds of book value. The five-year record of cash generation explains most of that discount.
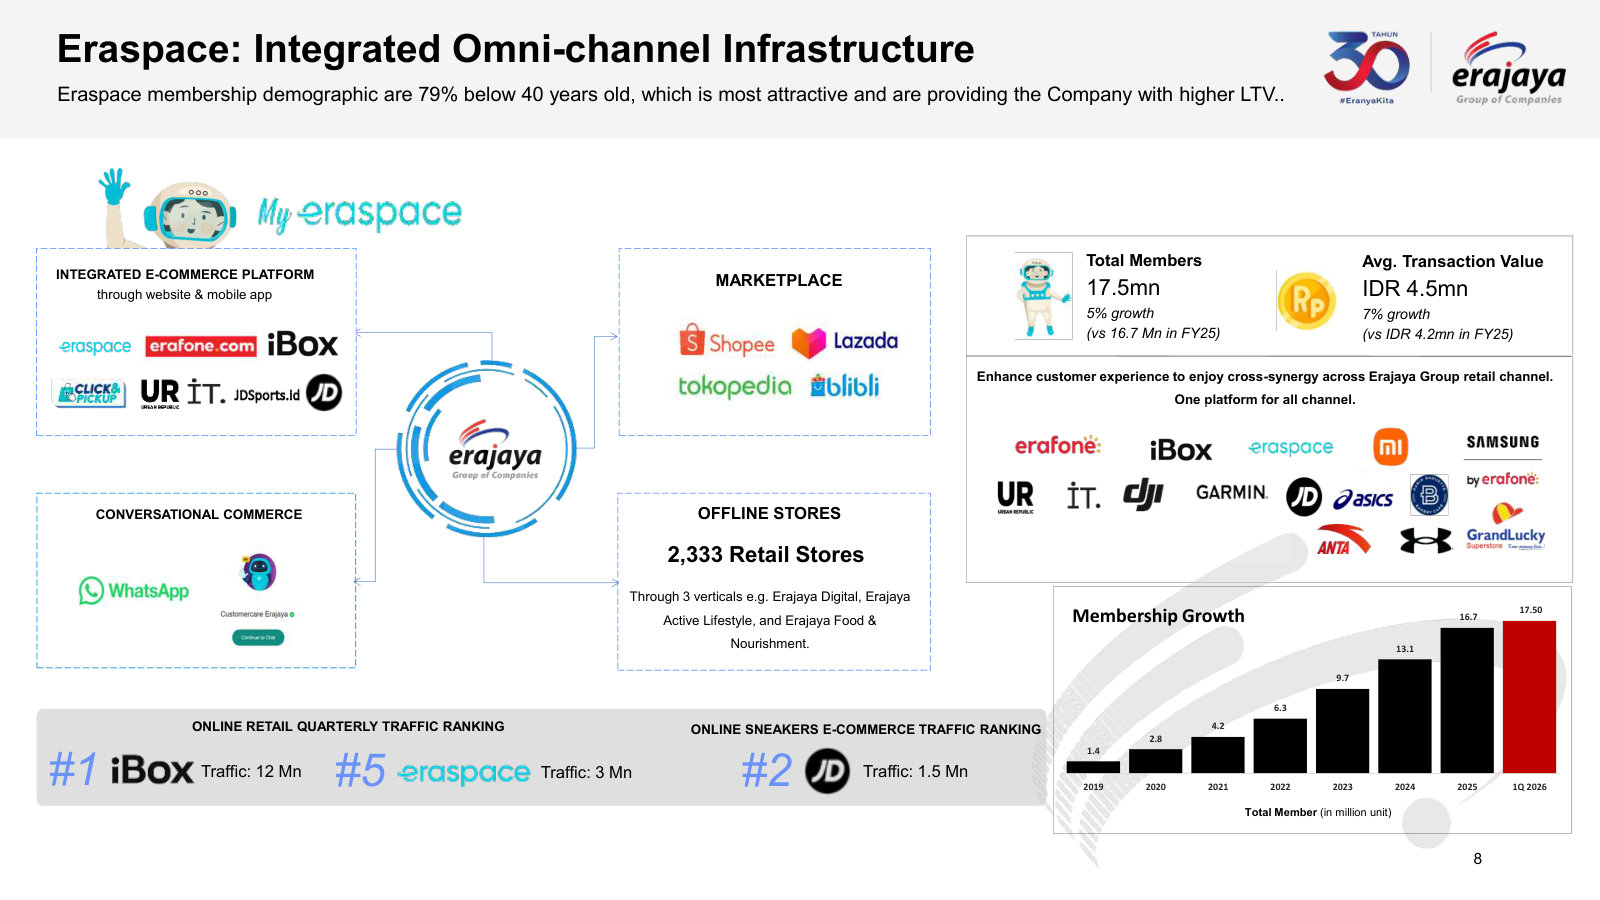
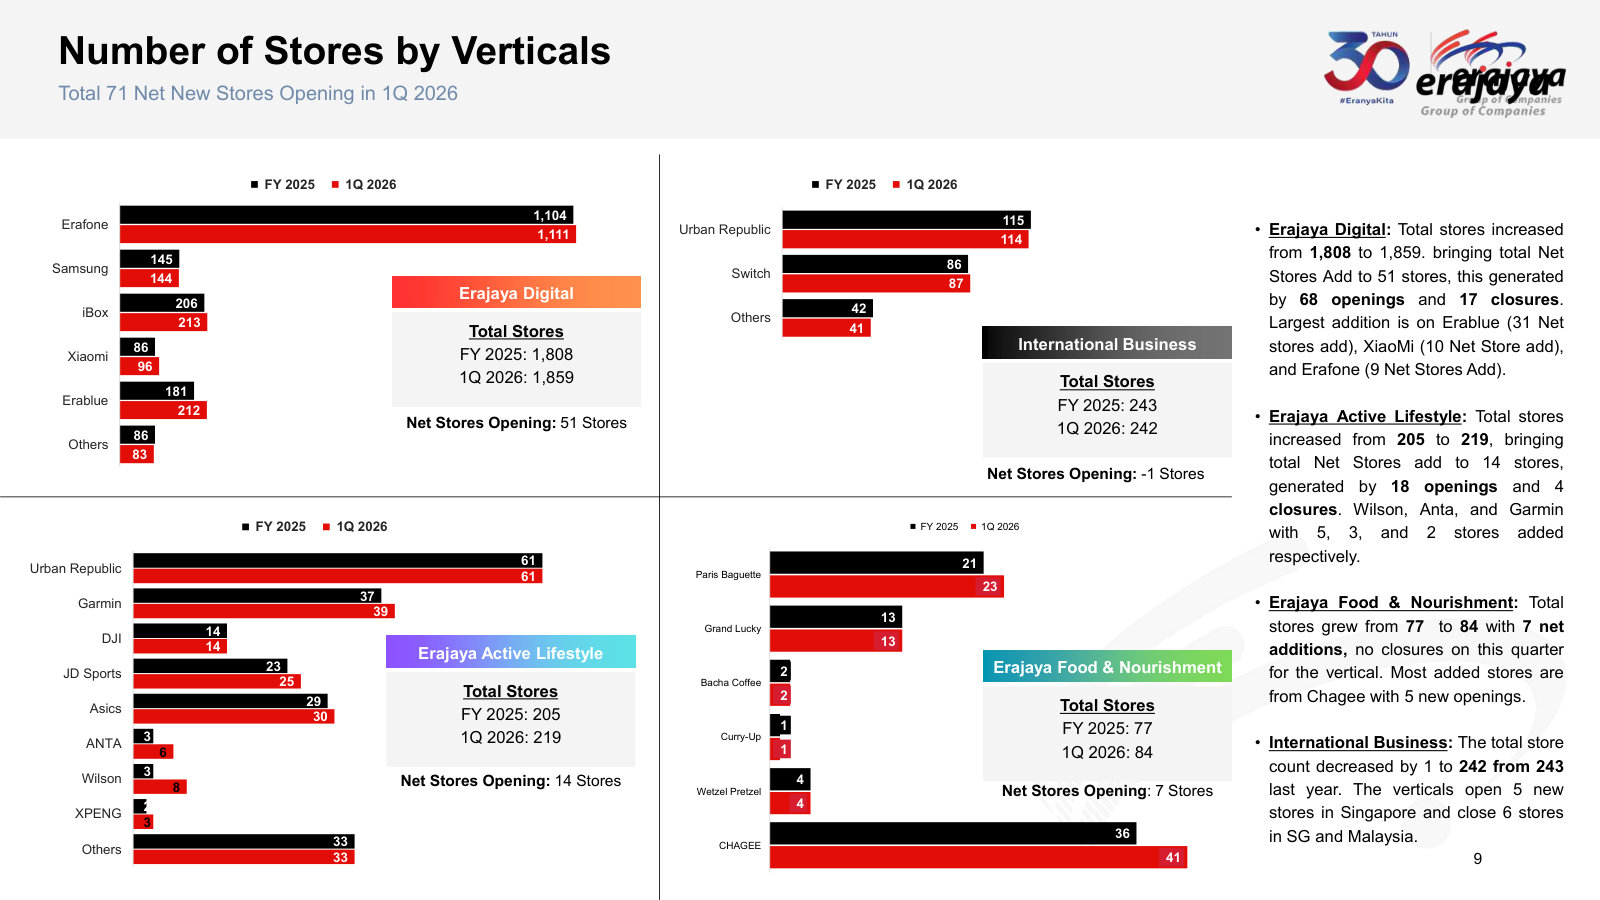
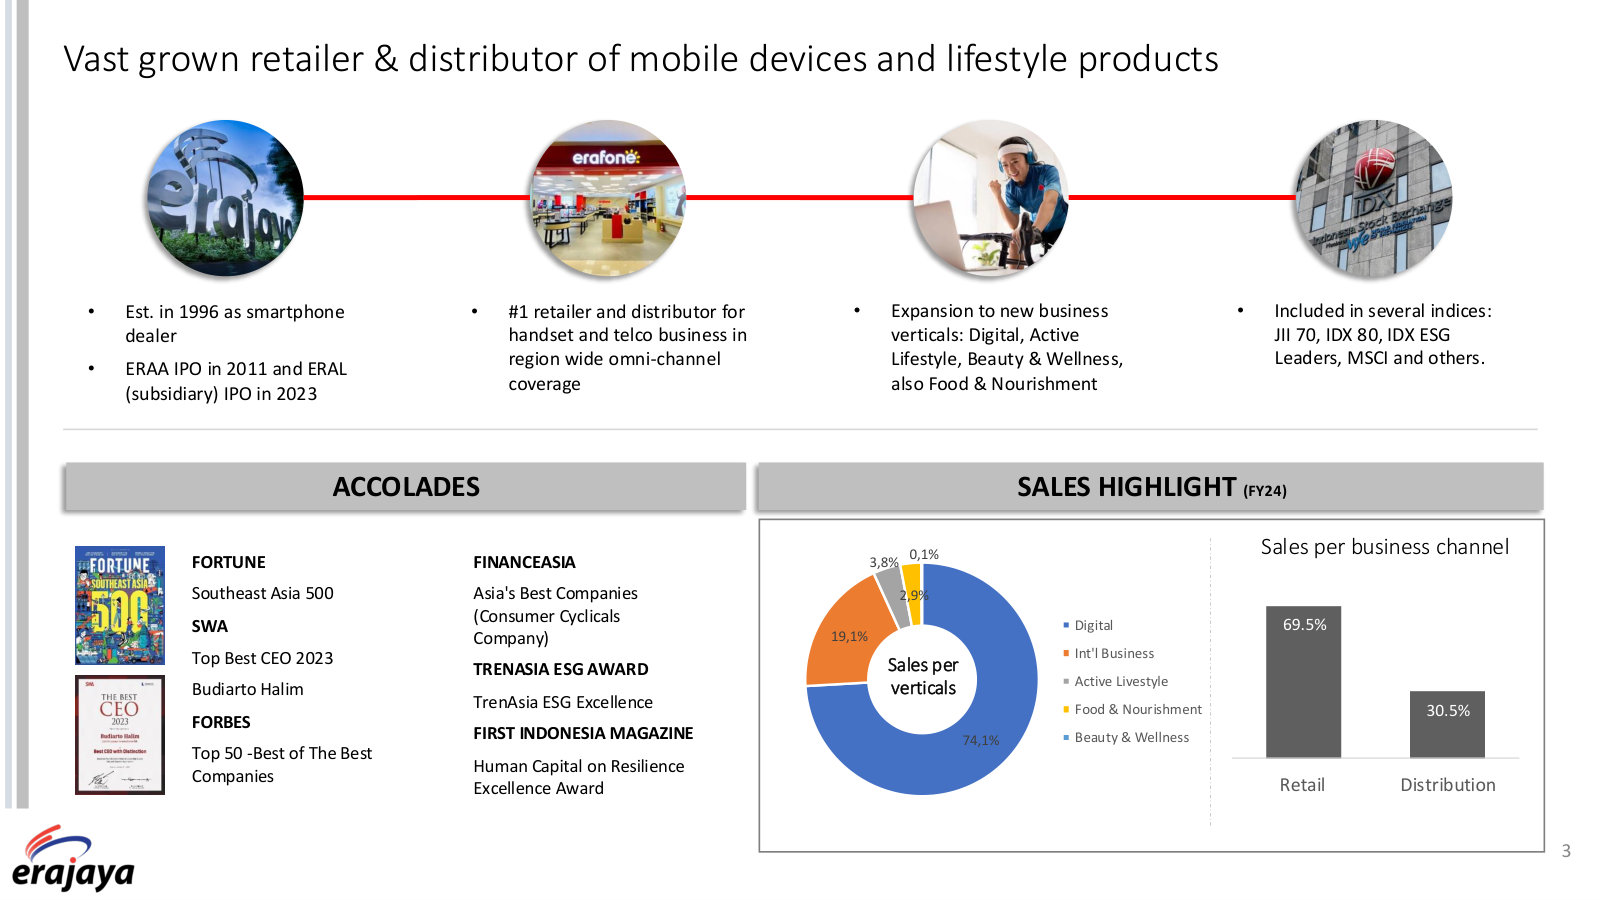
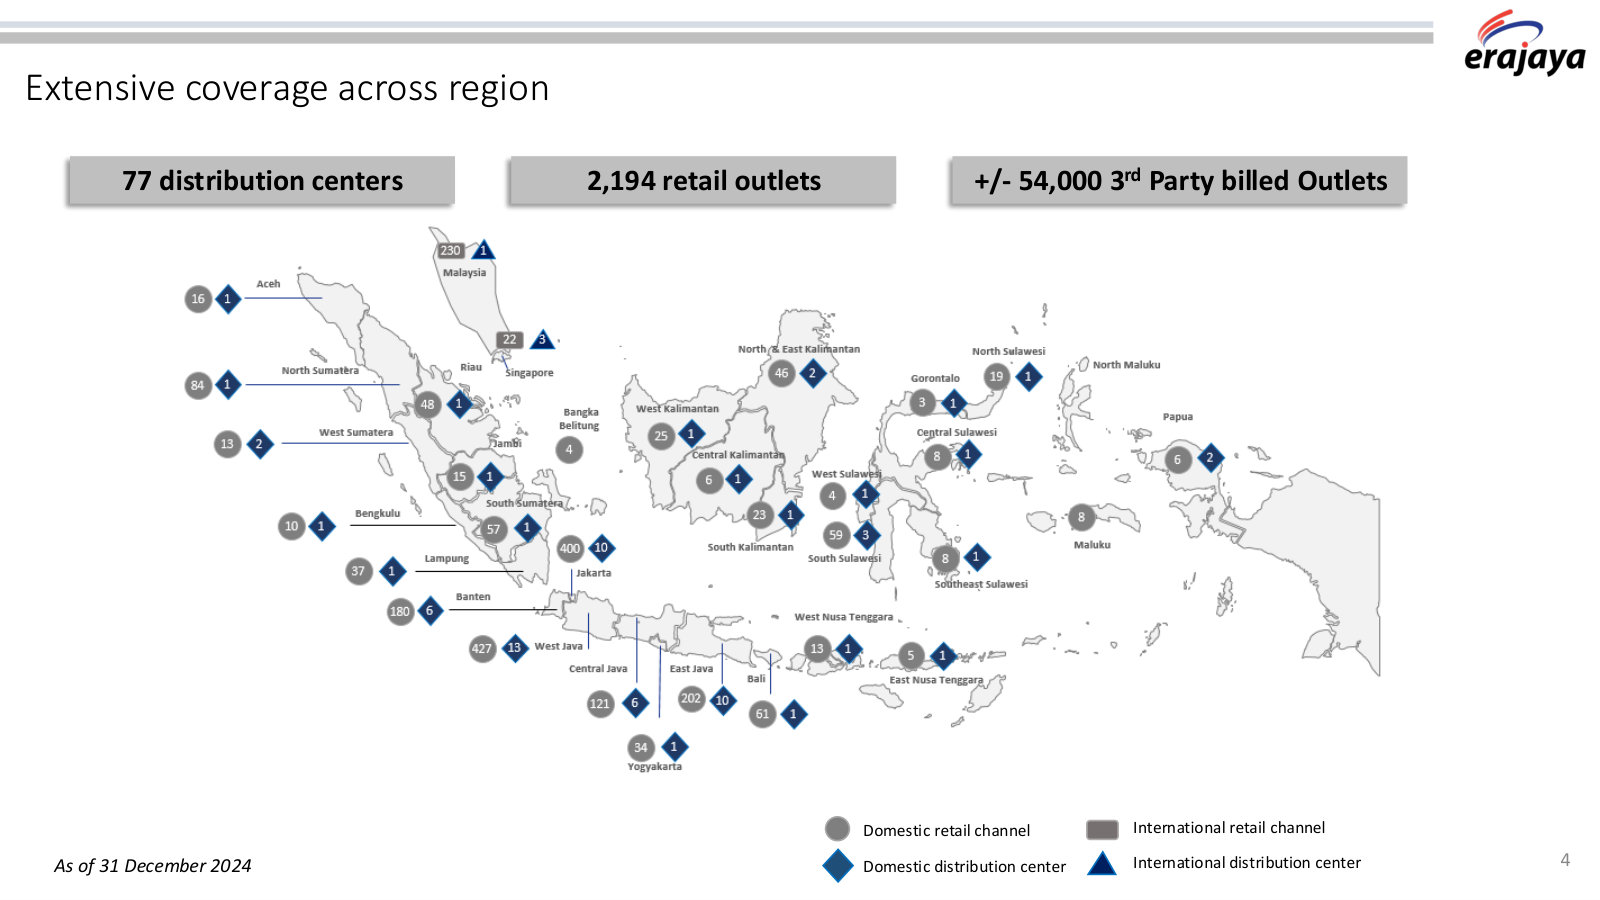
Erajaya buys phones from Apple, Samsung, Xiaomi and other principals, moves them through 70 wholesale distribution points and about 54,000 registered third-party resellers, and sells them through 2,333 of its own retail outlets [12] [13]. The retail estate is a mix of own-brand multi-brand stores and principal-branded shops it operates under licence: 1,104 erafone outlets, 206 iBox (Apple) stores, 181 Erablue electronics stores, 145 Samsung Experience Stores and 86 Mi stores in Indonesia, plus about 240 digital-retail outlets in Malaysia and Singapore [14]. Around that core sit three declared verticals: Erajaya Digital (phones, laptops, operator products), Erajaya Active Lifestyle (Urban Republic, JD Sports, MST Golf, Asics, Anta, DJI, Garmin, and XPENG electric vehicles) and Erajaya Food and Nourishment (Paris Baguette, Chagee, Wetzel's Pretzels, GrandLucky Superstore) [15]. Employees number 6,061, with a further 11,847 contractor and subcontractor staff [16].
FY2025 Net Sales ($m)
Profit to Owners ($m)
Market Value ($m)
Price / Trailing Earnings
Sources: FY2025 Annual Report, Key Financial Data Overview [17] and Stock Overview [18]; H1 2026 interim statements [19]; closing price of $0.0212 on 28 July 2026 [20]. Market value uses the 15.95 billion shares in issue. Trailing earnings are FY2025 owner earnings less H1 2025 plus H1 2026; the multiple is computed in rupiah, where trailing earnings are Rp89.77 per share.
Where the gross profit comes from
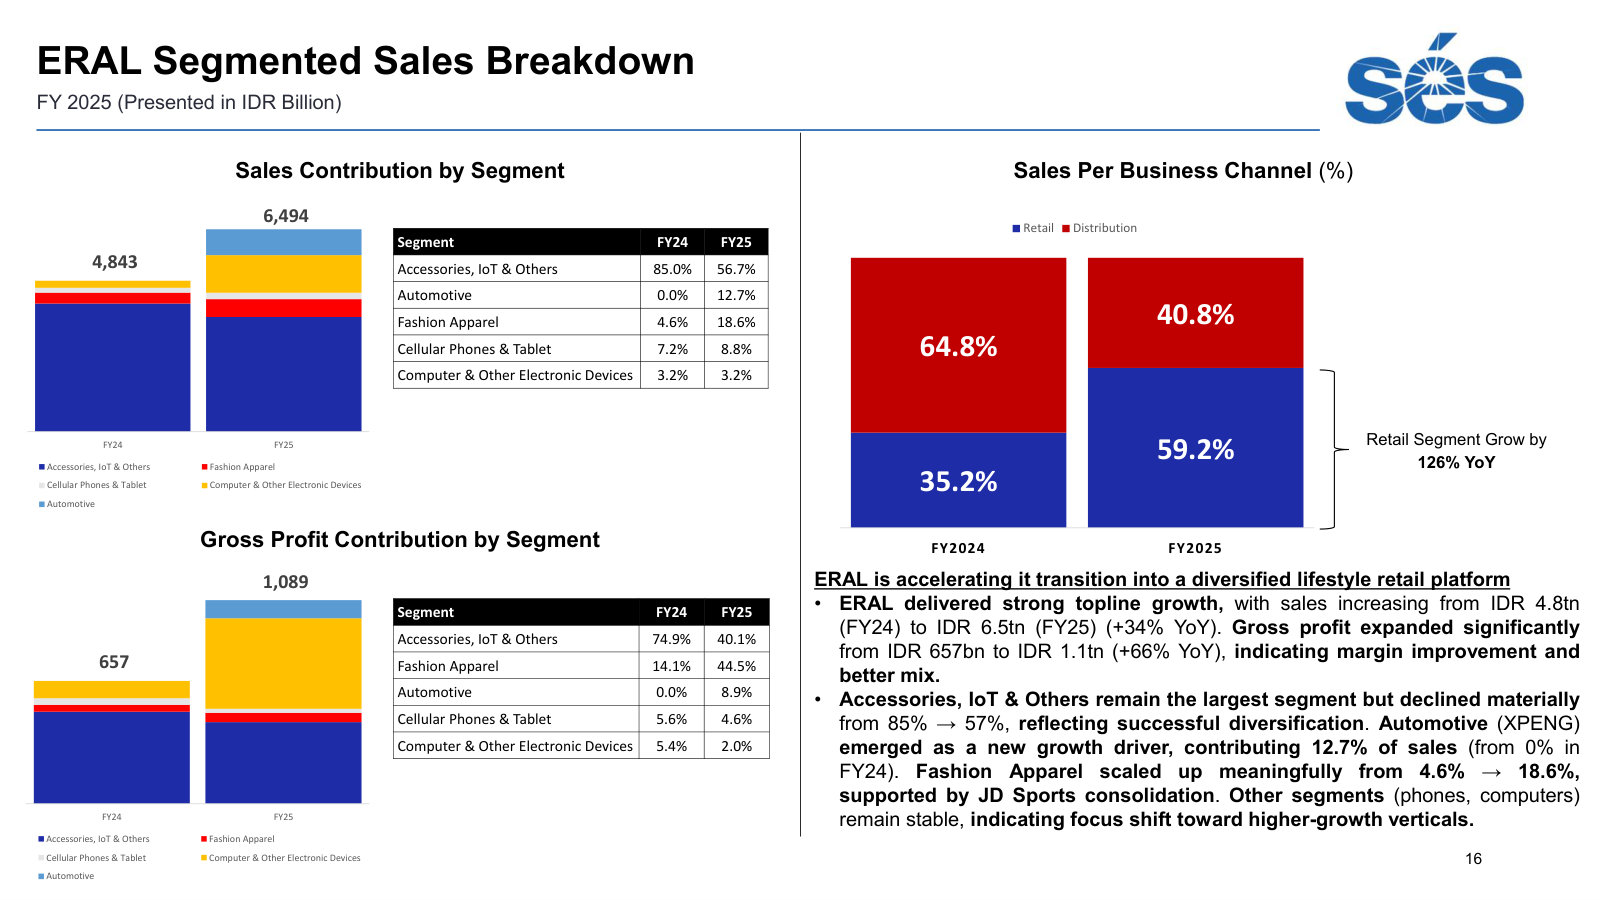
Phones and tablets are 78% of sales and 63% of gross profit [21] [22]. They carry an 8.8% gross margin, down from 9.5% the year before. The "accessories and others" line — which is where the lifestyle, apparel, food and beverage businesses sit — is 15.6% of sales at a 23.1% gross margin, and it supplied 33% of group gross profit in 2025 against 27.8% in 2024 [23]. That shift is the arithmetic behind management's diversification story, and it is real: gross profit from the accessories and others line grew 36% in a year while phone gross profit grew 6%.
Source: FY2025 Annual Report, Note 35 Segment Information [24]. Margins and gross-profit shares derived from the reported segment table.
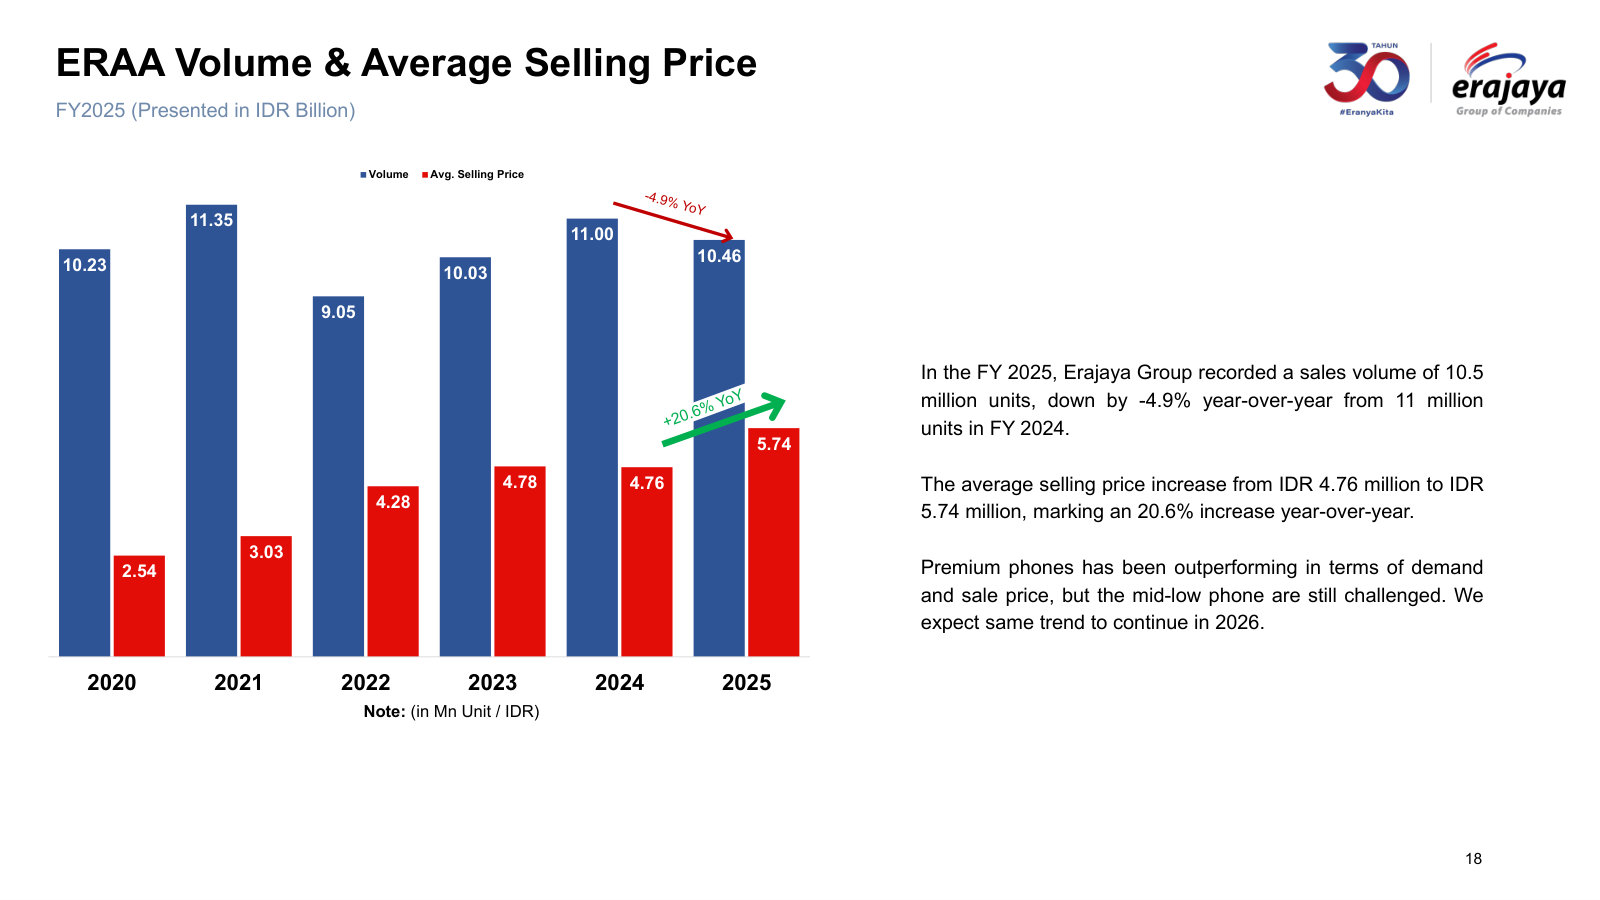
The industry backdrop is genuinely favourable and management describes it plainly: Indonesian smartphone shipments above 40 million units in 2025, 5G device share rising from 25.8% to roughly 35%, and the premium segment recovering after the iPhone 16 series won local-content approval in March 2025 [25]. Rising average selling prices lift Erajaya's revenue almost mechanically. They do not, by themselves, lift the margin on each unit.
From $4.60 billion to $71.8 million
The income statement is a thin funnel. Gross profit of $501 million (10.9% of sales) is reduced by $230 million of selling and distribution costs and $167 million of general and administrative costs, leaving $146 million of operating profit — 3.2% of sales — after $45 million of other income [26]. Finance costs of $38.5 million then take 26% of that operating profit, tax takes $32.5 million, and minority holders in the listed and unlisted subsidiaries take $7.0 million. $71.8 million reaches the parent's owners, or $0.00454 per share [27].
Two of the larger cost lines are worth naming because they are structural to Indonesian device retail rather than discretionary: $45.0 million of depreciation on leased store space and $34.3 million spent on credit-card instalment sales programmes. Together they consume 15.8% of group gross profit [28].
Sources: FY2023 Annual Report, Summary of Key Financial Data for FY2021–FY2023 [29]; FY2025 Annual Report, Key Financial Data Overview [30]. Margins derived from reported sales, gross profit, operating profit and profit attributable to owners.
The gross margin has sat in a narrow band between 10.7% and 11.1% for five years [31] [32]. The operating margin fell from 3.8% to 3.2% over the same period, and the owner net margin from 2.3% to 1.6%, because the store estate and the interest bill grew faster than gross profit. Sales rose 76% between 2021 and 2025 in rupiah; profit to owners rose 18%.
What the market has paid
Erajaya was a market favourite in 2021. At the end of the second quarter of that year the shares closed at $0.0483 and the company was worth $770 million [33]. At $0.0212 on 28 July 2026 it is worth $339 million [34]. Sales over the same stretch went from $3.04 billion to $4.60 billion [35] [36]. Across 2023, 2024 and 2025 the shares traded in a band between $0.0187 and $0.0354 and ended each year within $0.0024 of $0.0240 [37] [38].
Sources: Stock Highlights tables in the FY2021 [39], FY2023 [40] and FY2025 [41] Annual Reports; sales from the FY2023 [42] and FY2025 [43] Annual Reports.
The arithmetic at $0.0212 is undemanding. Trailing twelve-month earnings per share of $0.00513 — FY2025's $0.00454 less the $0.00216 earned in the first half of 2025 plus the $0.00275 earned in the first half of 2026 — put the shares on 4.3 times earnings in rupiah terms [44] [45]. Equity attributable to owners was $521 million at 30 June 2026, so the market pays 0.65 times book [46]. Sell-side coverage is uniformly positive, with a mean twelve-month target of $0.0277 [47]. At $0.0212 the shares trade 23% below the $0.0277 mean target and at 0.65 times book.
Where the capital sits
The capital sinks behind that conversion gap sit on the balance sheet and in the cash flow statement rather than in the earnings line. Over the five years to 2025 Erajaya reported $352 million of profit and collected $239 million of net operating cash, against $226 million spent on fixed assets — the components of the $13 million free-cash total behind the conversion gap [48] [49] [50] [51]. Lease payments of $51.5 million in 2025 sit below that line, in financing [52]. With lease payments charged above the line, the five-year free-cash total turns negative.
Sources: consolidated cash flow statements in the FY2022 [53], FY2023 [54] and FY2025 [55] Annual Reports; profit for the year from the FY2023 [56] and FY2025 [57] Annual Reports. Profit includes non-controlling interests; capex is acquisitions of fixed assets and advances for their purchase. Each year is converted at its own period-end rate, so the dollar series also carries five years of rupiah depreciation.
FY2025 is the sharpest illustration. Operating cash flow fell to $13.5 million from $138.8 million, because inventories rose 63% to $699 million and total assets rose 32.5% [58] [59]. Short-term bank loans nearly doubled to $299 million to fund it [60]. Total liabilities reached 1.84 times equity and the current ratio slipped to 1.16 [61].
A second, more unusual claim on capital sits in the tax line. Erajaya imports, and Indonesian import withholding tax (Article 22) is levied on the value of goods rather than on profit. In 2025 the parent company alone credited $99.3 million of Article 22 tax against a current tax charge of $9.1 million, generating a refund claim of $93.0 million for that year alone [62]. Consolidated estimated claims for tax refund stood at $217.7 million at end-2025, against $225.6 million a year earlier — the rupiah balance was essentially unchanged [63]. Old claims are collected and new ones replace them; the balance behaves like a permanent, non-interest-bearing loan to the state worth 40% of owners' equity and 59% of the market value of the company. At 30 June 2026 essentially all of it — $192.5 million of a $193.2 million total — had been reclassified as non-current, meaning the company no longer expects to recover it within twelve months [64].
Sources: FY2025 Annual Report, Consolidated Statement of Financial Position [65] and Equity [66]; 30 June 2026 interim statements, assets [67], liabilities [68] and equity [69]. Interest-bearing debt sums short-term bank loans, current maturities of long-term bank loans and bonds, and non-current bank loans. Each date is converted at its own rate, so dollar movements include the change in the rupiah.
The strongest fact against reading that as a permanent trap is the most recent one. In the six months to June 2026 the working-capital cycle ran the other way: operating cash flow was positive $102.5 million, against negative $294.7 million in the same period of 2025 [70]. Erajaya used it to repay $75.7 million of bank debt, redeem $37.9 million of bonds and buy back $5.4 million of its own shares [71]. Interest-bearing debt excluding leases fell from $491 million to $339 million and the remaining bank borrowing was termed out, with non-current bank loans rising from $27.8 million to $129.0 million [72]. Half-year sales rose 22.4% to $2,359 million, operating profit 28.3% to $79.1 million, and profit to owners 38.0% to $43.1 million [73] [74].
Six months is one turn of a seasonal cycle, and inventories were still higher in June 2026 than in December 2025 in rupiah terms [75]. The read that fits the evidence is that Erajaya's cash generation is cyclical around a low average rather than absent, and that the discount to book has more to do with how much capital the growth consumes than with doubt about the earnings themselves. Two consecutive years in which operating cash flow, after lease payments, covers capital expenditure and the dividend would settle it; a repeat of 2025's inventory build funded by short-term bank lines would settle it the other way.
Who owns it
PT Eralink Internasional held 55.17% of the shares at the end of 2025, up from 54.51% at the start of the year — the controlling holder added 105.3 million shares during a year in which the stock went nowhere [76]. The annual report names the ultimate beneficial owner as Ms Rebecca Halim [77], and the boards are drawn substantially from the founding family: Budiarto Halim is President Director, Alexander Halim Kusuma President Commissioner [78]. The public float is 43.94% and treasury stock 0.88% [79]; foreign institutions hold 19.24% [80]. A buyback authorised for 2025 was deliberately not executed, which management attributed to market conditions and capital-allocation priorities; a $5.4 million repurchase did follow in the first half of 2026 [81] [82]. Dividends paid in 2025 were $18.0 million, 29% of the previous year's profit attributable to owners [83].
The question this report follows
Erajaya has grown net sales from $3.04 billion to $4.60 billion in five years while its market value fell from $770 million to $339 million. The question this report follows is whether that growth can be converted into cash for owners at a rate that justifies more than the 0.65 times book value and roughly four times earnings the market currently pays — given that the inventory, tax receivables and short-term bank debt the growth requires absorbed almost all of the reported profit over the same period.
Everything that follows bears on one side of that arithmetic or the other: the durability of the phone franchise and the economics of the newer verticals; how much of the balance sheet is genuinely recoverable; what the family that controls 55% of the shares does with the capital; and what has to be true for the discount to close.
Figures converted from Indonesian rupiah at historical FX rates — see data/company.json.fx_rates. Ratios, margins, and multiples are unitless and unchanged. Growth rates quoted in the prose are computed in rupiah; because the rupiah weakened over the period, dollar figures compound more slowly than those rates imply.
What three years of accounts show
Erajaya's sales grew 12.9% a year over FY2023–FY2025 and profit attributable to owners grew 20.3% a year, but the trading margin did not improve: operating profit before the "other income" line was flat between FY2024 and FY2025, and almost all of the increase in reported operating profit came from foreign-exchange gains and an undisclosed residual. The half year to 30 June 2026 grew sales 22.4% year on year and carried trailing earnings per share to 12.8% above the FY2026 consensus, which still models FY2026 revenue below the twelve months already reported.
Sales CAGR FY2023-FY2025
Owner Profit CAGR FY2023-FY2025
FY2025 Owner Net Margin
Trailing EPS to Jun 2026 ($)
Sources: FY2025 Annual Report, Key Financial Data Overview [1]; H1 2026 interim statements [2]. Growth rates and trailing earnings derived from reported figures; trailing EPS is FY2025 less H1 2025 plus H1 2026.
The income statement, line by line
The three audited years and the two most recent half years sit below in one frame. Sales rose from $3.91 billion in FY2023 to $4.60 billion in FY2025 [3], and profit attributable to owners from $53.7 million to $71.8 million [4] [5]. Basic earnings per share moved $0.0034, $0.0041, $0.0045.
Sources: FY2025 Annual Report, Consolidated Statement of Profit or Loss [6] and attribution [7]; audited FY2023 statements [8] [9]; 30 June 2026 interim statements, sales and operating profit [10] and profit attributable to owners [11]. Converted from rupiah at fiscal-period rates, so lines may not sum exactly. Finance income and associates combines the two lines as reported.
Three features carry through. The gross margin sits in a narrow band — 10.72%, 11.15%, 10.90% — so gross profit tracks volume, not pricing power. Operating expenses grew faster than gross profit in FY2025: gross profit added $64.5 million while selling, distribution, general and administrative costs added $63.0 million. And the share of profit leaking to minority holders is rising, from 3.6% of group profit in FY2023 [12] to 8.9% in FY2025 [13] and 10.1% in H1 2026 [14].
Where the extra operating profit came from
With the "other income" line stripped out of operating profit, the picture changes. Trading operating profit — gross profit less selling, distribution, general and administrative costs, less other expenses — was $100.9 million in FY2023, $104.8 million in FY2024 and $100.9 million in FY2025. That is a 0.6% decline in the year sales grew 17.4%, and a fall in the trading margin from 2.59% to 2.19% of sales.
Source: derived from the consolidated statements of profit or loss, FY2025 Annual Report [15] and audited FY2023 statements [16]. Trading operating profit is operating profit less other income.
Reported operating profit rose $18.2 million in FY2025. Other income rose $18.7 million. The note behind that line shows what moved: a net foreign-exchange gain of $12.2 million against $1.2 million the year before, and an "Others" residual of $11.2 million against $5.3 million [17]. Those two items together supplied $17.1 million, or 94% of the increase in operating profit. Promotion support from suppliers — the item most tied to the trading business — added only $1.6 million.
Sources: FY2025 Annual Report, Note 29 Other Income [18]; audited FY2023 statements, Note 29 [19]. $ million. The residual column folds in gains and losses on fixed-asset disposals, lease write-offs and the undisclosed "Others" line.
The same pattern runs through the first half of 2026. Operating profit rose $17.4 million year on year; other income rose $10.6 million of that, with the foreign-exchange gain up $1.7 million and the "Others" residual up $5.8 million to $8.8 million [20]. Trading operating profit did grow — $52.6 million to $55.1 million, up 14.2% in rupiah — but on 22.4% sales growth, so the trading margin still slipped, from 2.50% to 2.33%.
The strongest fact against reading this as low-quality earnings is that foreign-exchange gains on an importer's dollar payables are a real economic outcome, not an accrual: Erajaya buys in dollars and sells in rupiah, so a firmer rupiah genuinely lowers the landed cost of inventory. What is not established is repeatability. A currency gain is a price outcome the company does not control, and the "Others" residual — $11.2 million in FY2025, $8.8 million in six months — is disclosed as a single unexplained figure. My read is that the FY2025 profit growth should be treated as substantially non-recurring until a year appears in which trading operating profit itself grows; the evidence that would settle it is a full year of the "Others" line broken out, or an FY2026 in which trading operating profit grows at least in line with sales.
Cash against reported profit
Over the three years, reported profit and operating cash flow are close in total — $203.9 million against $209.6 million — but neither the year-by-year path nor the after-investment position is comfortable.
Sources: FY2025 Annual Report, Consolidated Statement of Cash Flows [21]; audited FY2023 statements, operating and investing [22] and financing [23]; 30 June 2026 interim cash flow statement, operating and investing [24] and lease liabilities in financing [25]. Lease payments sit in financing activities, so operating cash flow is stated before them.
Lease payments are the largest such adjustment for a retailer with this store estate. Erajaya paid $144.4 million of lease liabilities across the three years, all of it classified as financing. With those and the three-year capital expenditure of $164.0 million deducted from $209.6 million of operating cash, the group consumed $98.8 million of cash over FY2023–FY2025 while reporting $203.9 million of profit. The five-year version of that arithmetic sits in Business and Balance Sheet; the three-year window with leases included is worse, not better.
The second gap is tax. The income statement charged $82.3 million of tax across the three years; the cash flow statement shows $237.1 million actually paid [26] [27]. The difference is the Article 22 import withholding regime: the parent alone credited $99.3 million of Article 22 tax in FY2025 against a current tax charge of $9.1 million [28]. The balance sheet carries the result: $86.4 million of current and $131.2 million of non-current estimated claims for tax refund, plus $109.4 million of prepaid taxes, at 31 December 2025 [29]. Whether that $327 million is collectible on the terms the accounts assume is the asset-quality question this chapter does not resolve; what it does establish is that reported earnings and cash have been separated by tax timing, not only by working capital.
H1 2026 is the counter-evidence. Operating cash flow of $102.5 million covered capex of $23.9 million and lease payments of $27.1 million [30] with $51.5 million to spare, and cash taxes paid fell to $12.0 million from $42.3 million a year earlier [31].
The half year just filed
Sales for the six months to 30 June 2026 were $2.36 billion against $2.10 billion, up 22.4% in rupiah; profit attributable to owners was $43.1 million against $34.1 million, up 38.0%; earnings per share $0.0028 against $0.0022 [32] [33]. The effective tax rate fell to 24.1% from 29.8% [34].
Part of that growth is a change in the consolidation perimeter rather than trading. PT Era Blu Elektronik — the Erablue electronics venture — appears as a 55.00%-owned subsidiary at 30 June 2026 with total assets before eliminations of $108.3 million, against no holding shown for 2025 [35]. Its $16.7 million carrying cost left the joint-venture line on the change of control [36], and it now carries $18.2 million of the $80.6 million minority-interest balance [37]. By product line, computers and consumer electronics rose 80.6% and Active and Lifestyle goods rose 244.8%, against 16.7% for cellular phones and tablets [38]. The interim statements do not disclose how much revenue Erablue contributed after consolidation, so the organic growth rate cannot be separated from the filings. That is a real limit on extrapolating the half.
Supplier mix also moved. Purchases from Apple South Asia fell to $753.6 million, 31.94% of consolidated net sales, from $995.7 million and 47.35% a year earlier, while Samsung purchases rose to $388.3 million, or 16.46% [39].
Consensus against the run rate
The consensus set carried in this report is dated 29 July 2026: FY2026 revenue of $4.41 billion and earnings per share of $0.0044, FY2027 revenue of $4.62 billion and earnings per share of $0.0054, with a mean twelve-month target of $0.0277 and no sell ratings in any of the compilations. Those figures sit against a scheduled reporting date of 30 July 2026, and the corpus does not establish whether individual analysts had already marked their models to the interim statements already lodged.
Sources: actuals from the FY2025 Annual Report [40] and the 30 June 2026 interim statements, sales and profit for the period [41]; FY2026 and FY2027 lines are consensus estimates compiled for this report, dated 29 July 2026. Trailing twelve months is FY2025 less H1 2025 plus H1 2026.
The arithmetic of the gap is straightforward. Trailing twelve-month revenue of $4.65 billion already exceeds the FY2027 consensus revenue line of $4.62 billion, and trailing earnings per share of $0.0049 sits 12.8% above the FY2026 consensus of $0.0044. For the FY2026 revenue estimate to hold, the second half must deliver $2.05 billion — 10.3% below the $2.49 billion of H2 2025 and 13.1% below the half just reported. For the earnings estimate to hold, second-half earnings per share must be $0.0016, against $0.0024 in H2 2025: a 25.7% fall year on year and a 41.1% fall from the half just reported. The second half has been the weaker half on earnings per share in two of the three years available and on revenue in one [42], so a softer H2 is not itself unusual — but the largest sequential decline in the record is 2.9% on revenue, in H2 2024, and 19.9% on earnings per share, in H2 2023. The consensus implies a step down several times larger than either.
Sources: half-year sales from the 30 June 2024 [43] and 30 June 2026 [44] interim statements; full-year sales from the FY2025 Annual Report [45] and audited FY2023 statements [46]. Second-half figures are full year less first half; the final bar is the FY2026 consensus revenue estimate less reported H1 2026. Each half is converted at its own period rate.
The FY2027 estimate is internally different in character. Revenue growth of 4.8% on the FY2026 base with earnings per share up 22.5% implies profit to owners of roughly $84.2 million on $4.62 billion of sales — an owner net margin near 1.82%, above anything the group has posted for a full year, though H1 2026 ran at 1.83%. So the FY2026 number understates a revenue line the company has already passed, while the FY2027 number leans on a margin the company has only held for six months.
Price / Trailing EPS
Price / FY2026 Consensus EPS
Price / FY2027 Consensus EPS
Price / Book, 30 Jun 2026
Sources: closing price of $0.0212 on 28 July 2026 [47]; equity attributable to owners of the parent of $521.4 million at 30 June 2026 on 15.95 billion shares in issue [48]; earnings per share as tabulated above. Multiples derived.
At $0.0212 the market pays 4.3 times what the company has already earned in the last twelve months and 0.65 times the book value of the equity owners hold. The gap between the consensus multiple of 4.85 times and the trailing multiple of 4.30 times is the difference between an estimate dated before the interim filing and earnings already reported.
What would change the read
Three checks are specific enough to settle, each against a named line in a filing.
Trading operating profit for FY2026 — operating profit less other income, from the consolidated statement of profit or loss. It ran at $55.1 million in H1 2026 against $100.9 million for all of FY2025. A full year above roughly $107 million would mean the trading business, not the currency, is doing the work; a year near $94 million would confirm that three years of profit growth have come from items outside the trade.
The "Others" line inside Note 29. It reached $11.2 million in FY2025 and $8.8 million in six months without a breakdown. A disclosed composition, or a year in which it recedes toward the $4.2 million of FY2023, would resolve how much of reported operating profit is durable.
Second-half sales and earnings per share against the consensus-implied $2.05 billion and $0.0016. The FY2026 annual report settles both, and the quarterly filings settle them sooner. A second half merely level with H2 2025 puts FY2026 earnings per share near $0.0049, which is where the trailing figure already sits.
One limitation is worth stating plainly: live web research was unavailable during this pass, so post-filing analyst revisions, any company guidance issued alongside the interim statements, and the market's reaction to them could not be checked. The corpus contains no earnings-call transcripts for Erajaya, so management's own account of the half is not quotable here.
Figures converted from Indonesian rupiah at historical FX rates — see data/company.json.fx_rates. Ratios, margins, and multiples are unitless and unchanged.
What the state owes Erajaya
The second-largest asset Erajaya owns is money the Indonesian tax office is holding: $193 million of estimated claims for tax refund at 30 June 2026, plus $107 million of prepaid taxes [1]. Together that is 57.6% of equity attributable to owners [2] and 88.7% of the company's market value. The multi-year record shows the claims come back at close to face value — and that they have never come back fast enough to stop the pile growing.
Erajaya imports. Indonesian Article 22 withholding tax is levied on the value of goods crossing the border, not on the profit earned selling them, and a distributor whose parent-company taxable income is a thin slice of import value will overpay every year by construction. In 2025 the parent credited $99.3 million of Article 22 tax against a current tax charge of $9.1 million — it prepaid 10.9 times what it owed — and booked a $93.0 million refund claim for the year [3]. In 2024 the ratio was 19.6 times: $87.6 million credited against $4.5 million charged [4]. This is a structural feature of importing at scale under Article 22, not a one-off dispute or a contested assessment.
Refund Claims, 30 Jun 2026 ($m)
Of Owners' Equity
Of Market Value
Annual Interest Equivalent ($m)
Sources: estimated claims for tax refund and prepaid taxes per the consolidated statement of financial position at 30 June 2026 [5] and equity attributable to owners of the Parent Company [6]; interest equivalent derived at the midpoint of the 6.50%-7.25% Rupiah bank-loan rates disclosed for 2025 [7]; market value of $339 million on 15,950,000,000 shares.
How the balance grew
The pile was not always this size. In the IPO offering memorandum, consolidated estimated claims for tax refund were $2.2 million at 31 December 2008, $3.3 million at 31 December 2010 and $3.3 million at 30 June 2011 [8]. Against the $193 million carried today, claims were then a rounding error.
Sources: estimated claims for tax refund, current and non-current, per the consolidated statements of financial position, FY2022 Annual Report [9], FY2023 Annual Report [10], FY2025 Annual Report [11] and the 30 June 2026 interim statements [12].
The step change happened in one year. The balance was $83.4 million at the end of 2022 and $125.8 million at the end of 2023 [13]. It reached $225.6 million at the end of 2024 and has sat near that level since [14]. The vintage tables explain it: at the end of 2023 the parent carried one year's claim, the 2023 vintage of $83.0 million [15]. At the end of 2024 it carried two, the 2023 vintage of $79.1 million and the 2024 vintage of $86.8 million [16]. Nothing was written off; the recovery cycle simply lengthened by a year, and two years of claims have been outstanding at every balance sheet date since.
One reading of the June 2026 balance sheet deserves correcting. Almost the whole block — $192.5 million of $193.2 million — sits in non-current assets [17]. That is not a new judgement about collectability. It is the normal state: 99.7% of the estimated claims were non-current at 31 December 2022 and 98.5% at 31 December 2023 [18] [19]. A claim becomes current only once the tax office issues its assessment letter, and those letters arrived on 12 December 2024 and 11 December 2025 — which is why the two most recent December balance sheets showed a current chunk and the June one does not [20].
The collection record
On the evidence in the filings, this is a good receivable. The tax office has assessed the parent's last two claims within a whisker of what was claimed, and the money has followed.
Sources: Note 31 Taxation, tax assessment letters received by the Company and its subsidiaries, 30 June 2026 interim statements [21] [22]; FY2025 Annual Report Note 31 [23]. Parent claim-year timing derived from the vintage tables.
The parent claimed $83.0 million for fiscal 2023 and was assessed $82.9 million — a shortfall of $95,000, or 0.114%, charged to income tax expense [24]. For fiscal 2024 it claimed $86.74 million and was assessed $86.73 million, a shortfall of about $1,900 on $87 million [25]. Once assessed, subsidiaries were paid in one to two months: TAM's $25.1 million was assessed on 24 June 2025 and paid on 21 July 2025 [26]. Older vintages clear too — the subsidiaries' 2022 vintage came off the table during 2024, leaving a $1.3 million tail of 2020 and 2021 claims behind it [27].
The one contested case cuts the other way and should be named. Subsidiary SES claimed a $1.30 million refund for fiscal 2024 and instead received an underpayment assessment of $5,400; it lodged an objection with the Directorate General of Taxes on 19 May 2026 and had no decision as at the reporting date [28]. That is a claim rejected in full. It is also $1.3 million — 0.6% of the block. A pattern of denials on that scale would matter; a single one at this size does not.
Money out, money in
What the balance does not do is shrink. The parent's claim for a year is settled roughly two years after the withholding is paid, by which time one or two further years have accrued behind it.
Sources: estimated claims for tax refund arising per year from the Note 30/31 vintage tables, FY2022 Annual Report [29], FY2023 Annual Report [30], FY2024 Annual Report [31], FY2025 Annual Report [32] and the 30 June 2026 interim statements [33]; refunds collected derived as the year-on-year fall in each vintage.
Two periods stand out. In 2024 the parent collected nothing: its 2023 vintage went from $79.2 million to $79.1 million over the year, and the $93,000 difference was the assessment shortfall booked to tax expense, not cash [34] [35]. That is the year the block doubled. In the first half of 2026 the opposite happened and the block still barely moved: $76.9 million of the 2024 vintage came back, while a new 2026 claim of $71.8 million accrued in the same six months, leaving the consolidated balance down $6.3 million at $193.2 million [36].
Six months of 2026 generated 84% of a full 2025's claim. If the second half accrues at the same rate, the 2026 vintage lands near $143 million against $93 million for 2025, and the block moves above $220 million before the 2025 vintage is collected. Growth in imports is what feeds it, so the balance scales with sales rather than mean-reverting.
This also makes the cash tax line hard to read on its own. Income taxes paid were $128.2 million in 2024 and $35.5 million in 2025 [37], then $42.3 million in the first half of 2025 against $12.0 million in the first half of 2026 [38]. Those swings track when refunds landed, not whether the withholding slowed.
What the float costs
At 30 June 2026 the group carried $338.7 million of interest-bearing bank loans excluding leases against $72.2 million of cash [39] [40]. The refund claims alone equal 57% of that debt; add the $107.1 million of prepaid taxes and the tax authorities hold the equivalent of 89% of everything Erajaya has borrowed [41].
Rupiah bank facilities carried 6.50% to 7.25% during 2025 [42]. Applying that band to the $193.2 million of claims gives $12.6 million to $14.0 million a year of interest that would not be paid if the money were in the bank — against $71.8 million of profit attributable to owners in 2025 [43], and against $31.6 million of group interest expense before lease interest [44]. Roughly a fifth of what the owners earn, and close to half the group's interest bill, is the equivalent-financing cost of a two-year interest-free loan to the state. That figure is an opportunity cost, not an interest line the filings identify separately: the block is only partly funded by debt. It sits alongside $307.5 million of interest-free trade payables [45], and the bank facility committed specifically against the tax position is far smaller, at $16.5 million (Funding and Covenants). No interest compensation on the refunds appears anywhere in the filings.
The same fact shows up in the return on equity. Profit attributable to owners of $71.8 million on $548.5 million of owners' equity at the end of 2025 is 13.1% [46] [47]. Measured against the $330.8 million of equity left after setting the refund claims aside, it is 21.7%. The trading business earns 21.7% on the capital actually working in it; the gap to the 13.1% reported return is the roughly one-third of equity parked in the block. That decomposition is illustrative rather than exact — the block is funded by a mix of debt, payables and equity, not by equity alone — but it locates where the shortfall between a 13% return and a 22% one comes from.
What a haircut would actually do
For an investor buying at 0.65 times book, what matters is how much of that discount is protection against the block being worth less than stated. Not much of it, on this arithmetic: the block would have to be badly wrong before the multiple stopped looking low.
Source: derived from equity attributable to owners of $521.4 million and 15,950,000,000 shares at 30 June 2026 [48], applying stated write-downs to the $193.2 million of refund claims [49].
Writing off a quarter of the block takes price-to-book from 0.65 to 0.72. Writing off the whole of it — against an observed assessment record of 0.114% and 0.002% shortfalls — takes it to 1.03. The credit question, on the evidence available, is close to settled; the discount to book is not compensation for it.
The read this chapter supports is that the refund claims are a duration problem, not a solvency or accounting one. They convert at par, on a cycle of roughly two years, and they grow with imports — which means they consume cash permanently while the business expands and would release $193 million, more than half the market value, only if growth stopped or the withholding mechanism changed. The strongest fact against that read is the SES objection: one subsidiary claim was denied in full and remains unresolved, and if that becomes a pattern rather than an exception the credit assumption underneath everything above weakens. Three things in the next two filings would settle it. Whether the 2025 vintage of $93.0 million receives its assessment letter around December 2026, which would confirm the two-year cycle rather than a lengthening one. Whether the 2026 vintage annualises near $143 million, which would push the block past $220 million. And how the Directorate General of Taxes rules on the SES objection.
A meaningful share of the cash that does not reach owners is not a margin problem. It sits on deposit with the Indonesian tax office earning nothing, and carrying it costs roughly the group's 7% borrowing rate. That cost is an equivalent-financing charge rather than an identified interest line, since the block is only partly funded by debt.
Figures converted from Indonesian rupiah at historical FX rates — see data/company.json.fx_rates for the rate table. Ratios, margins, multiples, days-on-hand and percentages are unitless and unchanged.
Inventory Quality
Inventory is the group's largest asset — $686 million net at 30 June 2026, roughly 40% of the balance sheet — and the collateral under every bank line. It turns in about 50 days, realised write-downs run below 0.06% of the cost of goods sold, and it is now insured close to its carrying value: an asset that, on the numbers, does not threaten the balance sheet. The caveat is a judgment one. The obsolescence reserve was cut to 2.77% of gross inventory in the year the stock jumped 61%, and the provision charge is now rising as the mix tilts toward slower-moving lifestyle goods.
This chapter takes the working-capital build that the growth story turns on and looks at it from the asset side: what the inventory is, how fast it moves, what it is reserved and insured against, and where a skeptic would press.
The largest asset, and it is phones
At 31 December 2025 the group held $719 million of inventory at cost, against which it carried a $19.9 million obsolescence allowance, leaving $699 million net [1]. By 30 June 2026 the gross figure had grown again to $707 million, $686 million net [2]. That is comfortably the biggest line on the asset side — larger than the tax-refund block (Tax Refund Block), larger than receivables, and several times the cash balance.
Net inventory, 30 Jun 2026 ($m)
Phones & tablets, % of gross
Obsolescence reserve, % of gross
Source: Note 7, H1 2026 interim report [3].
The composition matters more than the total. Cellular phones and tablets were $489 million of the $707 million gross balance at 30 June 2026 — about 69% — with accessories and others the next $179 million [4]. Phones have sat between 64% and 76% of the stock at every year-end since 2022 [5][6]. That is the asset-quality tension in one figure: the bulk of the balance sheet is handsets, the fastest-obsolescing product the group sells and, at an 8.8% segment gross margin, the thinnest-cushioned against a markdown (Tailwinds and Margin).
Where the FY2025 cash went
The FY2025 inventory build is the asset side of the report's through-line. Between FY2021 and FY2025 Erajaya reported $352 million of profit but converted it into only $13 million of free cash flow ($239 million operating cash against $226 million of capex, before $51.5 million of FY2025 lease payments), because the growth was consumed by a $193.2 million Article-22 tax-refund block that in H1 2026 fell just $6.3 million even as $76.9 million was collected, and by a $686 million inventory whose FY2025 gross build of $273 million — 90% handsets — was roughly 3.4 times the $71.8 million earned for owners that year [7]. Cellular phones and tablets were $245 million of that $273 million increase — nine-tenths of it. This is the asset the reported profit was converted into rather than cash, and it was funded on short-term bank lines (Funding and Covenants).
Source: Note 7 across the FY2023 and FY2025 annual reports and the H1 2026 interim report [8][9][10].
The first half of 2026 is the useful counter-evidence. Phone inventory barely moved — $488 million to $489 million — while accessories and others jumped $57 million to $179 million [11]. The FY2025 handset build sold through rather than ageing on the shelf, consistent with the operating cash the half generated (Financials and Estimates). What replaced it is different stock: the lifestyle and accessories pool that carries the group's higher margins but also its slower turns and its genuine fashion-obsolescence risk.
Turnover and realised losses are reassuring
Measured against the cost of goods sold, the inventory moves quickly and has cost the group almost nothing in write-downs. On average balances, days-inventory-on-hand has held near 50 days for three years; the year-end 2025 snapshot looks heavier at about 62 days only because the build landed in the fourth quarter and unwound in early 2026.
Source: derived from reported net inventory in Note 7 [12][13] and cost of goods sold implied by reported revenue and the disclosed gross-margin band; margins per the financials chapter.
The write-down history is the stronger reassurance. The obsolescence charge taken through profit was $5.5 million in FY2023, a $1.0 million recovery in FY2024, and $2.2 million in FY2025 [14][15]. Even the heaviest of those years is 0.16% of the cost of goods sold; FY2025 is 0.05%. Whatever else is true of a phone distributor, this book has not, historically, had to be marked down in size — the fast turns keep the stock fresh enough that realised obsolescence is a rounding error against the flow of goods through it.
The reserve was thinned in the build year
The judgment call sits in the allowance. As gross inventory grew 61% in FY2025, the obsolescence reserve grew only 13% — $18.3 million to $19.9 million — so coverage fell from 3.97% of gross stock at end-2024, its highest in the series, to 2.77% at end-2025 [16]. The reserve rate was cut by roughly a third in the same year the book swung most heavily toward phones.
Source: Note 7 across the FY2023 and FY2025 annual reports and the H1 2026 interim report [17][18][19].
The sensitivity is modest but real. Had the group held its end-2024 reserve rate of 3.97% onto the larger end-2025 book, the allowance would have been about $29 million rather than $20 million — a $9 million pre-tax difference, roughly 12% of the $71.8 million owners' profit for the year, or about 9% after tax. That is illustrative, not a claim that the reserve is wrong: management argues the coverage tracks physical condition and net realisable value, and freshly-landed launch stock genuinely warrants less provision than ageing inventory [20]. The point is that the reported FY2025 profit already carries a reserve assumption that was loosened, not tightened, into the build.
The direction of travel now runs the other way. The half-year charge to 30 June 2026 was $2.3 million — already more than the whole of FY2025 — against $1.8 million in the first half of 2025 [21]. The provision is accelerating just as the mix shifts toward the accessories and lifestyle stock that is harder to clear than a current-model phone. A rising obsolescence charge on a book that is turning fine is not alarming on its own; it is worth watching precisely because it coincides with the slower-turning inventory taking a larger share.
Collateral and insurance
The whole of this asset sits behind the bank facilities. Note 7 records that certain of the borrowers' inventories are pledged as collateral for the bank loans, cross-referenced to the funding note [22]. Inventory plus trade receivables is the borrowing base the maintenance covenants are tested against, and that ratio was comfortably covered at every measurement date (Funding and Covenants). The filings do not quantify how much of the stock is specifically pledged — the language is "certain of the Debitors' inventories" — so the reader is left with a security interest of undisclosed extent over the group's largest asset.
Insurance coverage has caught up to the book only recently. The blanket policy covered $352 million of inventory at end-2024 — about 80% of the net balance — rising to $641 million at end-2025 and $678 million at 30 June 2026, by which point cover finally sat close to carrying value [23][24]. For a business whose value is concentrated in physical stock held across warehouses and 2,300-plus outlets, the gap between insured value and book value that ran through 2024 and 2025 is a detail a bankruptcy-averse owner would have wanted closed sooner than it was.
What would change the read
The asset-quality picture is favourable on the evidence that matters most — turns and realised losses — with a reserve judgment that has been loosened rather than tightened. Two things would move it:
- A step-up in the obsolescence charge. The first-half 2026 run-rate already annualises to roughly double FY2025. If the full-year FY2026 charge lands materially above that, the fast-turn reassurance weakens and the thinned reserve looks less like fresh stock and more like under-provisioning.
- Phone inventory rising while sell-through slows. The comfort rests on handsets clearing quickly. Phone inventory climbing at year-end 2026 against flat or falling unit shipments — rather than the clean H1 2026 pattern of flat phone stock and strong cash — would point to channel-loading or stale premium stock after a launch, the two ways a phone book turns genuinely bad.
Neither is visible in the record to 30 June 2026. On the numbers to hand, the group's largest asset is high-quality, fast-moving, pledged to an undisclosed extent and now adequately insured — a reassurance for the near-zero-bankruptcy lens, tempered by a reserve that flatters the reported profit at the margin and an obsolescence trend that has just turned up.
Funding and Covenants
Figures converted from Indonesian rupiah at historical FX rates — see data/company.json.fx_rates. Ratios, margins, and multiples are unitless and unchanged.
Erajaya funds its inventory with annually-renewed, secured bank lines from two Indonesian banks, and the collateral is the inventory and receivables themselves. At 30 June 2026 interest-bearing debt was $438.9 million against $601.9 million of equity — 0.73 times, versus a 2.0 times internal ceiling. Every disclosed covenant is met with room to spare, and the tightest test is measured on 30 June, not on the December balance sheet the annual report prints.
How the balance sheet is funded
The debt stack is short, secured and bank-held. At 30 June 2026 short-term bank loans were $185.0 million, the current portion of long-term bank loans $24.7 million, and the non-current portion $129.0 million [1]. Adding lease liabilities and the other interest-bearing items the company itself counts, total interest-bearing debt was $438.9 million against equity of $601.9 million, a ratio of 0.73 times [2]. The group's stated policy is to hold that ratio to not more than 2.0 times [3].
Interest-Bearing Debt ($m)
Total Equity ($m)
Debt / Equity (policy cap 2.0x)
Cash ($m)
Source: Q2 FY2026 consolidated financial statements, Note 38 Capital Management and consolidated statement of financial position [4] [5].
The ratio has been stable inside a narrow band while the business doubled its inventory: 0.86 times at 31 December 2023, 0.73 times at 31 December 2024, 0.92 times at 31 December 2025 and 0.73 times again at 30 June 2026 [6] [7] [8].
Source: FY2024 Annual Report, Note 38 [9]; FY2025 Annual Report, Note 38 [10]; Q2 FY2026 statements, Note 38 [11].
Secured, annual, and concentrated
Two Indonesian banks carry almost all of it. PT Bank Central Asia has been a lender since a joint-borrower agreement signed on 14 December 2009; PT Bank Mandiri joined with its own joint-borrower agreement on 28 August 2023 [12] [13].
Three features of those agreements matter more than the headline leverage.
The security is the working capital. The BCA facilities are secured on the receivables and inventories of the borrowing entities, plus land and buildings with a net book value of $35.2 million at 31 December 2025 [14]. The Mandiri facilities are secured on the same receivables and inventories [15]. In substance this is borrowing-base lending: the asset that consumes the cash is also the asset that supports the borrowing.
The tenor is one year, renewed. The BCA joint-borrower facilities ran to 13 May 2026 and were extended to 13 May 2027 [16]. The Mandiri facilities ran to 14 September 2025 and were extended to 14 September 2026 [17]. The record of extensions is unbroken across the five annual reports in the corpus, but the legal position renews each year rather than terming out.
The lenders hold approval rights over corporate actions. Under the BCA agreement the borrowers must obtain written approval before making new investments or establishing new businesses, selling core fixed assets, changing the composition of the boards of commissioners, directors or shareholders, acting as guarantor or pledging assets, taking new loans from another lender, or lending to third parties. Changes in the shareholding of named subsidiaries that would take the parent below 51 per cent also require consent. Declaring a dividend requires notification rather than approval [18]. Mandiri holds a comparable set [19].
The trade financing sits alongside. BCA provides bank guarantee and standby letter of credit capacity of up to US$175,000,000 plus $35.8 million of rupiah-denominated capacity, and Mandiri a standby letter of credit line of up to US$150,000,000 [20] [21]. Supplier credit at this group is therefore not free-standing trade credit; a material part of it rests on the same two bank relationships as the cash borrowings.
The covenant tests, computed
BCA requires four maintenance ratios: a current ratio of not less than 1.0 times; EBITDA to interest expense of not less than 1.5 times; the sum of accounts receivable and inventories to outstanding short-term working-capital bank loans of not less than 1.1 times; and EBITDA after tax to total loan principal and interest payments of not less than 1.2 times. The company reports compliance at 31 December 2025 [22]. Mandiri requires three of the same four [23].
Three of them can be recomputed from the filed statements. The first two are shown below; the debt-service test depends on a contractual definition of scheduled principal that the filings do not give, so it is left out rather than estimated.
Source: derived from the consolidated statements of financial position at each date — FY2023 audited statements [24], FY2024 audited statements [25], H1 2025 statements [26], FY2025 Annual Report [27] and Q2 FY2026 statements [28] [29].
The current ratio has drifted down and remains the binding constraint in practice. At 31 December 2025 current assets of $1,193.7 million covered current liabilities of $1,029.4 million by $164.3 million [30]. A 13.8 per cent write-down of current assets, with liabilities unchanged, would take the ratio to 1.00. That is a wide margin, but it is the narrowest reading in the corpus and it narrowed in each of the three Decembers before the June 2026 recovery to 1.264, when current assets of $1,005.2 million stood against current liabilities of $795.0 million [31] [32].
Interest cover is not close to its floor. Operating profit plus depreciation and amortisation was $179.5 million in FY2023, $203.1 million in FY2024 and $229.4 million in FY2025, against interest expense of $33.1 million, $34.2 million and $31.6 million — cover of 5.4, 5.9 and 7.3 times against a 1.5 times minimum [33] [34] [35]. On the twelve months to 30 June 2026 the figures are $234.0 million and $29.4 million, or 7.9 times [36] [37].
Source: derived from the FY2024 Annual Report Notes 27, 28 and 30 [38] [39], the FY2025 Annual Report Notes 15, 28 and 30 [40] [41] and the Q2 FY2026 statements Notes 15, 27, 28 and 30 [42] [43].
The peak is not at year-end
The December balance sheet is the one that gets audited, printed and quoted, and in this business it is systematically the calm point. Short-term bank loans stood at $169.5 million at 31 December 2024 and $474.1 million six months later, on 30 June 2025 — 2.9 times the figure the FY2024 annual report carries [44] [45].
Sources: quarterly and audited consolidated statements of financial position, December 2023 through June 2026 — FY2023 [46], FY2024 [47], H1 2025 [48], FY2025 [49] and H1 2026 [50].
The covenant arithmetic follows the same rhythm. At 30 June 2025 receivables and inventories of $769.4 million covered short-term bank loans of $474.1 million by 1.62 times — still comfortably above the 1.1 times floor, but less than half the 3.03 times cushion the previous December balance sheet had shown [51] [52]. Anyone underwriting the balance sheet from annual reports alone sees leverage at its December low, below where it runs at the mid-year peak against which the covenant is tested.
Liquidity has the same shape. The FY2025 maturity table shows $518.1 million of financial liabilities repayable on demand and a further $502.0 million falling due within a year, against $62.0 million due in one to five years and cash of $127.9 million [53] [54]. Roughly 94 per cent of the group's financial obligations sit inside twelve months. What makes that workable is not cash but undrawn capacity.
Undrawn capacity
At 30 June 2026 the two Indonesian relationship banks had extended revolving and overdraft limits of $594.0 million that were effective on the date: a BCA overdraft line of $88.0 million, BCA Time Loan 1 of $189.8 million, Time Loan 2 of $68.8 million effective (of an $85.3 million facility), Time Loan 3 of $82.5 million, and a Mandiri joint-borrower revolving facility of $165.0 million [55] [56]. Drawings against those two banks on the same date were $114.7 million of BCA revolving loans, $0.2 million of BCA overdraft, $36.0 million of Mandiri revolving loans, and the parent's $68.8 million long-term drawing from BCA, which matches the Time Loan 2 limit exactly and which the FY2025 note confirms is carried in long-term debt [57] [58].
Source: derived from Q2 FY2026 consolidated financial statements, Note 16 Bank Loans [59] [60] [61].
That leaves roughly $374 million undrawn on the two core relationships, against $72.2 million of cash [62]. It is also more headroom than existed a year earlier: Time Loan 3 of $82.5 million first appears in the 31 December 2025 disclosure, and Time Loan 2 was raised from $68.8 million to $85.3 million during the first half of 2026 [63] [64]. The caveat is that these are facility limits with stated expiry dates, not multi-year irrevocable commitments; the whole stack is re-underwritten annually by two counterparties who already hold the inventory as security.
A credit line sized to the tax claim
One line in the June 2026 disclosure connects the funding to the receivable examined in Tax Refund Block. Time Loan 2 was increased to $85.3 million, and the note states that the additional $16.5 million "will only become effective upon the submission of written proof that the application for a Tax Exemption Certificate (SKB) has been rejected by the government" [65].
Two facts follow from that sentence. Erajaya has applied for an exemption from the import withholding that creates its refund claims — an attempt to stop the drag at source that appears nowhere else in the filings. And its principal lender has pre-committed the bridge financing that becomes necessary if the application fails: BCA has committed a $16.5 million Time Loan 2 tranche that becomes effective only on written proof that the SKB application was rejected.
The filings do not say when the application was lodged or when a decision is expected, and no outcome is disclosed. Treated as a watch item rather than a forecast: an SKB granted would remove one of the larger reasons this company carries a working-capital facility; an SKB refused draws $16.5 million more debt.
What the notes repayment removed
Until 2026 the group also carried a Singapore dollar bond. On 24 August 2023 Erajaya Digital Pte. Ltd. issued SGD50,000,000 of senior notes, guaranteed by the Credit Guarantee and Investment Facility, a trust fund of the Asian Development Bank, at a 4.50 per cent coupon with a three-year tenor and a 1.25 per cent per annum guarantee fee. The notes were rated AA by S&P Global on the strength of that guarantee, and were due on 24 August 2026 [66]. They were repaid during the first half of 2026, at a cash cost of $37.9 million [67], and the balance is nil at 30 June 2026 [68].
The indenture carried the tightest covenant package the group has had: a current ratio of at least 1.00, a debt service coverage ratio of at least 1.50, a gearing ratio of at most 2.00, consolidated gross debt to EBITDA of at most 3.50, an interest coverage ratio of 1.50, and a security coverage ratio of at least 125 per cent of the outstanding bonds — all tested every six months [69]. Among those tests, the leverage ratio indexed gross debt to earnings, and it was moving: gross interest-bearing debt to EBITDA ran 2.54 times in FY2023, 2.02 times in FY2024 and 2.46 times in FY2025, before easing to 1.88 times on the twelve months to 30 June 2026. Repaying the notes removed the ceiling at the point in the cycle where the ratio had just risen by nearly half a turn.
That is a smaller loss than it sounds — the company's own 2.0 times gearing policy is unchanged, the bank package retains the current-ratio, borrowing-base and interest-cover tests, and repaying a foreign-currency obligation with local-currency cash flows reduces the currency mismatch on the liability side. It is nonetheless one fewer independent party checking the leverage every six months.
What would change this read
The evidence points to a funding structure that is safer than the short maturity profile first suggests: covenants met with wide margins, gearing at 0.73 times against a 2.0 times ceiling, roughly $374 million of undrawn capacity, and a first half of 2026 in which $75.7 million of bank debt and $37.9 million of bonds were repaid [70] against $102.5 million of net cash from operating activities [71].
The strongest fact against that read is the mechanism of the collateral. Because the security and the covenant base are both the inventory, a shock that impairs inventory value cuts the borrowing base and the covenant ratio at the same moment, and does so at a company whose entire facility stack is re-underwritten annually by two lenders. FY2025 is the closest thing to a live test: operating cash flow of $13.5 million funded none of the $47.8 million of capital expenditure or the $51.5 million of lease payments, and the gap was met with $239.5 million of gross new bank drawings against $86.7 million of repayments [72]. The banks funded that year. The untested case is a year in which the inventory also had to be marked down at the same time.
Three observations would change the read. A December current ratio below about 1.10, which on the FY2025 balance sheet would cut the cushion between current assets and current liabilities from $164.3 million to roughly $103.2 million. A renewal of the BCA joint-borrower facilities on materially tighter terms in May 2027, or a shortening of the extension period from the twelve months granted each year since 2009. And an obsolescence charge against the $686.4 million inventory large enough to move the borrowing-base ratio — the provision already swung from a $1.0 million net recovery in FY2024 to a $2.0 million net charge in FY2025, on a base that has since grown again [73] [74].
Tailwinds and Margin
Figures converted from Indonesian rupiah at historical FX rates — see data/company.json.fx_rates for the rate table. Ratios, margins, and multiples are unitless and unchanged.
Indonesia's smartphone market is a genuine tailwind: unit volumes have moved past 40 million a year, 5G's device share has climbed from 17.1% toward 35%, and premiumisation is lifting average selling prices [1] [2]. Erajaya rides it as the self-described largest single-entity handset distributor and retailer [3]. But the tailwind reaches owners as volume, not margin. Blended gross margin has sat inside a 10.7%–11.1% band for five years while sales grew 76%, and the phone line that carries the growth earns 8.8%.
Net Sales FY2025 ($bn)
5-Yr Sales CAGR
Blended Gross Margin FY2025
Phone-Segment Margin FY2025
Source: FY2025 Annual Report, MD&A income table and segment note [4] [5]; CAGR derived from FY2021–FY2025 net sales.
The tailwind is real
The demand backdrop has improved through a full product cycle, and the filings track it year by year rather than asserting it. At the start of the period the story was potential: the FY2021 report named 5G network rollout as a coming catalyst, before the devices or the coverage existed at scale [6]. The cycle then turned down: citing Counterpoint's tracker, the FY2023 report recorded Indonesian smartphone shipments falling 6% in 2023, a decline that reached 10% in the first half [7]. 2024 was the recovery — the market grew 15.5% to nearly 40 million units, 5G device share rose from 17.1% to 25.8%, and the average price of a 5G phone fell 20.4% to US$441 as the technology reached the mid-range [8]. For 2025 the company puts shipments above 40 million units again, 5G share near 35%, and 5G unit sales growing 50%–60%, with premiumisation and on-device generative AI pushing prices back up [9].
Source: FY2024 Annual Report (2023 and 2024) and FY2025 Annual Report (2025 estimate); 2025 is the company's projected ~35% [10] [11].
One episode shows how much of the economics sits with the vendors rather than the distributor. The premium tier (above US$600) fell 9.2% in 2024 partly because iPhone 16 sales were banned in the fourth quarter until Apple met Indonesia's 40% local-content rule (TKDN); once cleared in March 2025, the premium segment rebounded [12] [13]. A regulatory dispute between the Indonesian state and Apple swung the highest-value part of Erajaya's shelf for two quarters, and Erajaya was a bystander to it.
Where Erajaya sits
Erajaya's own framing is a scale claim: its investor deck calls Erajaya Digital "the Biggest Single Entity for Handset Business", and the FY2025 report attributes 17.4% net-sales growth partly to "the strengthening of the Company's market share" [14] [15]. Neither is quantified — no filing in the corpus attaches a share percentage to the claim — so it is a position asserted rather than a number a reader can check. What is documented is breadth: a 2,333-outlet estate and brand partnerships spanning Apple, Asus, DJI, Garmin, Google, GoPro, Huawei, Infinix, Nokia, Oppo, Realme, Samsung, Vivo, Xiaomi and Honor [16]. This is the raw material of a distribution moat: physical reach and a full roster of principals.
The corpus does not support a quantitative peer benchmark — the auto-selected peer set (Metrodata, Mitra Adiperkasa, Electronic City, UFO Elektronika, DOSS, Senheng) carries no populated financials in this run, so a like-for-like margin table cannot be built. Qualitatively, the adjacencies confirm the model is contestable rather than owned: Mitra Adiperkasa runs Digimap as an Apple reseller against Erajaya's iBox, and Metrodata distributes Infinix nationwide against Erajaya's distribution arm. Distribution mandates are not exclusive either — the March 2025 Honor agreement named both Erajaya and a second distributor. The position is real, but it is the position of the largest reseller of other companies' brands, not a set of rights a competitor cannot also hold.
The margin has not moved
If scale conferred pricing power, it would show in the gross margin as the business grew. It has not. Net sales rose from $3.0 billion in FY2021 to $4.6 billion in FY2025 — up 76%, a 15.2% compound rate — while blended gross margin stayed inside a 42-basis-point band: 11.1% in FY2021, 10.7% in FY2023, 11.1% in FY2024, 10.9% in FY2025 [17] [18] [19].
Source: FY2021, FY2023 and FY2025 Annual Reports, consolidated statements of profit or loss [20] [21].
Source: derived from reported net sales and gross profit, FY2021–FY2025 Annual Reports [22] [23] [24].
The tailwind flowed through the top line and stopped there. A distributor of other people's brands captures a spread, and this spread has proven fixed regardless of how much volume passes through it — a moat that widens throughput, not price. The picture is consistent with the operating-margin drift documented in Financials and Estimates: with the gross spread capped, operating margin depends on holding cost growth below sales growth, not on charging more.
Why the spread is capped
The segment detail explains the fixed blend. In FY2025 the phone-and-tablet line was 78% of external sales but earned an 8.8% gross margin — down from 9.5% a year earlier — and delivered 63% of group gross profit [25] [26]. The richest pool is "accessories and others" at a 23.1% margin — 16% of sales but a third of gross profit [27].
Source: FY2025 Annual Report, MD&A segment gross-margin table [28].
There is a real mix shift underway that should, on its own, be lifting the blend: accessories-and-others external sales grew from $258 million in FY2021 to $716 million in FY2025, from 8.5% of sales to 15.6%, while the low-value operator-products line shrank from $245 million to $93 million [29] [30]. That the blended margin still did not rise means the phone line's own compression — and the fact that the fastest-growing volume is the thinnest-margin phone shelf — has absorbed the mix benefit. The tailwind mostly inflates the 8.8% line.
Behind the phone margin sit two principals who set the terms. In the first half of 2026, purchases from Apple were 31.94% of consolidated net sales and Samsung 16.46% — 48.4% between them, down from 63.2% a year earlier as Apple's own share fell [31]. Two suppliers accounting for roughly half of what Erajaya sells is the structural reason the spread does not widen: the party that owns the brand, not the party that moves the box, holds the pricing.
Source: Q2 FY2026 consolidated financial statements, supplier-concentration note [32].
What it establishes, and what to watch
The moat reads as narrow at best. The reach — 2,333 outlets, the iBox Apple franchise, a full brand roster — is real and would cost a rival time and capital to replicate, but it has not produced pricing power, and pricing power is where a distribution moat pays owners. The strongest fact on the other side is the accessories-and-others pool: at a 23.1% margin and growing faster than the group, it is the pool most able to lift the blend, and the retail push behind it (own-brand stores, the newer verticals) is Erajaya's attempt to escape the reseller's spread. The read would change if the blended gross margin broke out of its five-year band to the upside — say above 11.5% for a full year — on accessories and own-retail mix rather than a one-off. Until then, the tailwind is a volume story running through a fixed spread, which is why, for owners, it turns on the cash conversion the rest of this report examines, not on the demand headline.
The watch items are specific and checkable. Blended gross margin holding its 10.7%–11.1% band would confirm the spread is structural; a sustained move above it would signal mix finally paying. The phone-segment margin — 8.8% and falling — is the single largest driver, since phones are three-quarters of sales. Accessories-and-others as a share of gross profit (33% in FY2025) measures whether the diversification is winning. And the Apple-plus-Samsung purchase concentration, already down to 48.4%, shows whether dependence on two principals is easing or the mix is simply rotating between them.
Figures converted from Indonesian rupiah (IDR) at historical FX rates — see data/company.json.fx_rates. Ratios, margins, and multiples are unitless and unchanged.
Minority Interests
The per-share figures the market prices Erajaya on — trailing earnings and book value attributable to owners — are struck after a deduction that is quietly getting larger. A growing share of group profit and equity belongs to minority partners in the very verticals that are growing fastest. Non-controlling interests took 10.1% of profit in the first half of 2026, a high for the series and up from a 3.6% trough in 2023, and reached 13.4% of equity by June 2026. The core phone business remains owner-controlled; the growth around it, less so.
NCI share of H1 2026 profit
NCI share of equity, Jun 2026
Group vs owner profit growth, FY23–FY25
Sources: H1 2026 interim statements, statement of profit or loss and financial position [1] [2]; FY2025 and FY2023 audited statements [3].
The wedge between group and owner profit
Every dollar of profit Erajaya reports splits two ways: to the owners of the parent, and to the outside shareholders of its partly-owned subsidiaries. Only the owners' slice reaches the EPS of $0.0049 and the equity of roughly $521 million that Financials and Estimates and Business and Balance Sheet valued the stock against. The minority slice is real profit, earned inside the consolidation, that belongs to someone else.
That slice is not on a straight line. It was 9.4% of group profit in FY2021, fell through the 2022–2023 downturn to a 3.6% low as the company simplified its structure ahead of a subsidiary listing, and has since climbed each period to a series high of 10.1% in the first half of 2026 [4] [5].
Sources: consolidated statements of profit or loss, FY2021 [6], FY2023 [7], FY2024 [8], FY2025 [9] and H1 2026 [10]. Each period is converted at its own period-end FX rate; 1H2026 is a six-month figure and its % share is period-comparable.
The clearest way to see the effect is to compare how fast the two slices grow. Between FY2023 and FY2025, group profit rose 53.2% but profit to owners rose only 44.8% — the 8.4-point gap is the widening minority claim [11] [12]. The half-year repeats it: group profit up 44.0% year on year, owner profit up 38.0% [13]. On the comprehensive-income line — which includes currency translation on the overseas subsidiaries — the minority share is higher still, at 11.8% of the H1 2026 total, because much of the foreign-exchange movement sits in partly-owned foreign entities [14].
Where the minorities sit
The balance sheet tells the same story from the equity side. Non-controlling interests grew from $57.2M at the end of 2024 [15] to $62.1M a year later, then jumped to $80.6M by June 2026 — from 10.2% to 13.4% of total equity in six months [16]. The June step is almost entirely one event, addressed below. The composition matters more than the total: the minority capital is concentrated in four vehicles, and they are not the core phone-distribution business.
Source: H1 2026 interim statements, Note 41 Non-controlling Interests in Subsidiaries [17]. "Other, net" nets a $3.6M deficit at Erajaya Digital Retail Pte Ltd against several smaller positives.
CG Computers Sdn Bhd is the largest single minority, at $25.2M. It runs Erajaya's Malaysian handset and IoT retail — the Switch, Urban Republic and Samsung stores that make up most of the International Business vertical [18]. PT Sinar Eka Selaras Tbk (SES), at $20.1M, is the reason the minority line exists at scale at all: SES listed on the Indonesia Stock Exchange in August 2023, selling 1,037,500,000 shares to the public at $0.025, which cut Erajaya's holding to 80.00% [19]. SES is not a peripheral asset — it is Erajaya’s active-lifestyle solutions arm, distributing gadgets and sport-lifestyle brands — DJI, Garmin, Shokz and others — alongside accessories and IoT devices [20]. That is the same 23%-gross-margin accessories pool that Tailwinds and Margin identified as the one lever capable of widening Erajaya's fixed reseller spread. One-fifth of it now accrues to SES's public shareholders rather than to Erajaya's.
The Erablue mechanics
The June 2026 jump in minority equity is the consolidation of PT Era Blu Elektronik, and its mechanics are worth stating precisely because they also inflate the reported growth rate. Era Blu is the consumer-electronics store chain built with Vietnam's The Gioi Di Dong (Mobile World). Erajaya's retail subsidiary has held 55% of it since March 2022, when Mobile World subscribed new shares and cut Erajaya from 98% to 55%; under a shareholders' agreement the venture was jointly controlled, so it was equity-accounted — one line in the income statement, no revenue on the group's face [21]. On 30 January 2026 the articles of association changed to give Erajaya's subsidiary control, and Era Blu became a fully consolidated subsidiary — at the same 55% ownership [22].
Two things follow. First, the change brought $108.3M of Era Blu assets onto the balance sheet and an $18.2M minority with them — the 45% that belongs to Mobile World [23] [24]. Second, part of the half-year's headline revenue growth is this reclassification, not organic demand: Era Blu turned over $59.1M in the first half of 2025 while still an off-balance-sheet joint venture, and that volume now sits inside consolidated sales [25]. The point Financials and Estimates flagged — that the half is not cleanly organic — is Era Blu.
The verticals carrying the minorities are also the lease-heavy ones. Group right-of-use assets rose from $115.7M at the end of 2025 to $152.4M at June 2026, against lease liabilities of $100.3M — an Era Blu-driven step-up that lands the fixed-rent obligations of a store network on the books while 45% of that network's profit is spoken for [26] [27].
The growth is where the ownership is thinnest
Erajaya reports its business as four verticals. In the first half of 2026 the two smallest — Active Lifestyle and Food and Nourishment — grew fastest, and both are carried substantially through partly-owned vehicles.
Source: H1 2026 interim statements, Note 35 Segment Information (vertical breakdown) [28]. The two half-years are converted at different period-end rates, so the International bar understates the rupiah growth cited below.
Active Lifestyle grew 41% and Food and Nourishment 32%, against 21% for the Digital phone core and 8% for the international arm [29]. Digital is still 74% of sales and is held almost wholly by owners; but the incremental growth — diversification away from the 8.8%-margin phone shelf — runs through SES (80% owned) and the Food and Nourishment ventures, several of which are minority-partnered and loss-making today. The Chagee tea joint venture lost $2.1M in the half, up from $0.2M a year earlier, and the MST Golf retail venture lost $0.5M [30]. Diversification is real, but it is being built with other people's capital, and the losses on the way up are shared while the margin, if it comes, will be too.
Reading the minority claim
The read is that a professional investor should measure Erajaya's growth in owner terms, not group terms — because the two are diverging, and the divergence is structural, not a one-off. Owner EPS will keep growing more slowly than consolidated sales for as long as the fastest-growing verticals are the partly-owned ones.
The strongest fact against treating this as a problem is that minority capital is funding the growth a cash-constrained parent could not easily fund itself. Tax Refund Block and Funding and Covenants showed a business whose working capital and tax receivables absorb most of its reported profit and whose bank lines are near-fully committed at their seasonal peak. Against that backdrop, selling 20% of SES to the public raised roughly $26.3M of external equity, and the Mobile World and Malaysian partnerships put someone else's balance sheet behind the electronics and overseas expansion [31]. A minority share of a business you could not otherwise have built is not the same as value leaking out of one you already owned. For the value investor weighing a 0.65x book, sub-5x earnings entry, the relevant point is narrower: the discount is struck on the owners' slice, and that slice is genuinely 87% of equity and 90% of profit today — the minority claim is a drag on the rate at which owner value compounds, not a hole in the base being bought.
What would change the read in either direction is observable. If the minority share of profit keeps climbing past the low-teens while owner EPS growth lags consolidated growth by widening margins, the diversification is compounding for partners faster than for owners. If instead the Food and Nourishment losses turn and SES's accessories margin lifts the blended spread that Tailwinds and Margin found stuck in a 42-basis-point band, the minority capital will have bought owners a better business. Three things are worth watching: the non-controlling share of each period's profit (10.1% in H1 2026, and whether it keeps climbing); whether Era Blu contributes owner profit or only revenue and minority losses now that it consolidates; and whether SES's own disclosures — it files separately as a listed company — show the accessories pool earning its keep.
Ownership and Pay
Figures converted from Indonesian rupiah at historical FX rates — see data/company.json.fx_rates. Ratios, margins, and multiples are unitless and unchanged.
Control sits with one family holding company, and it has been adding. Eralink went from 54.51% to 55.17% of the shares in issue during 2025, and $5.4 million of company buybacks in the first half of 2026 lifted its effective interest to 56.6%. The executives running the business own about a third of one percent between them, none of it bought in the market since 2021. Board pay for 2024 appears in two audited filings at two different numbers.
Who owns the company
The register is short. PT Eralink Internasional held 8,800,291,400 shares, or 55.17%, at 31 December 2025, up from 8,694,980,200 shares and 54.51% at the start of that year — a purchase of 105,311,200 shares over twelve months [1]. The public float was 43.94% and the company itself held 0.88% in treasury. The filings name Ms Rebecca Halim as the ultimate beneficial owner of the company's shares; the ownership-structure diagram in the same section places her at 32.04% within the structure above Eralink, and no filing in this corpus sets out Eralink's own share register in text [1] [2].
That headline percentage understates the family's economic position, because it is struck against all 15.95 billion shares in issue, including the ones the company has bought back and taken out of circulation. Measured against shares actually outstanding, the line moves.
Source: derived from the share register and treasury-share counts in the FY2025 Annual Report [1] [3] and the 30 June 2026 interim statements [4].
Three actions drove it. The company bought 166,515,100 shares between 30 March 2020 and 9 December 2022 at a cost of $4.15 million, taking shares outstanding to 15,783,484,900 [3]. It then transferred 25,751,978 of those treasury shares to management and staff between 1 October and 7 November 2025, lifting outstanding shares to 15,809,236,878 [3]. And between 29 January and 30 June 2026 it bought a further 250,673,800 shares for $5.37 million, leaving 15,558,563,078 outstanding [4]. Eralink's 8.80 billion shares are now 56.56% of the shares outside the company's own hands, against 55.09% at the end of 2024 — 147 basis points of accretion in eighteen months, without a tender offer, and most of it paid for out of the company's cash rather than the family's.
Shares bought, Jan-Jun 2026
Cost (US$ m)
Average price (US cents)
Source: Q2 FY2026 interim statements, Note 1b, and the consolidated statement of changes in equity [4].
The 2026 buying averaged 2.14 US cents a share against a first-half trading range of 1.77 to 2.29 cents — near the middle of that range, not the bottom of it. The 2020–2022 programme averaged 2.49 cents at the exchange rates of the day. Both sit close to where the stock trades today.
What the people running the business own
Fourteen individuals sat on the two boards at 31 December 2025 and held 51,754,584 shares between them — about a third of one percent of the company [2]. That is the whole of the personal stake: the filings state that no member of either board holds any shares indirectly [2].
Where those shares came from matters more than the total. The disclosure tables list the same individual holdings, share for share, at each year-end from 2021 through 2024: Budiarto Halim, Hasan Aula, Sim Chee Ping, Richard Halim Kusuma and Andreas Harun Djumadi at 6,250,000 each, Sintawati Halim at 7,500,000, Djohan Sutanto at 800,000 [5] [6] [7]. Not one of those numbers moves across four consecutive audited disclosures, and the board's combined holding was 47,416,400 shares at both 31 December 2023 and 31 December 2024 [7].
The entire increase to 51,754,584 by the end of 2025 came from the company, not from the market. In 2025 the board granted its directors options over 12,110,584 shares as a performance bonus, at an exercise price of 2.30 US cents [8]. Each director's holding at 31 December 2025 is the 2021 position plus exactly that allocation.
Sources: FY2021 Annual Report, Share Ownership by Management [5]; FY2025 Annual Report, Structure and Amount of Remuneration in 2025 [8] and Share Ownership by Management [2].
Two of the eight directors — Joy Wahjudi and Jong Woon Kim — owned nothing at all before the grant. Joy Wahjudi's record runs against the alignment story: he is listed with 6,250,000 shares at 31 December 2022 [6], does not appear in the equivalent table for 2024 [7] despite remaining Vice President Director throughout that year [9], and ends 2025 holding precisely his 1,904,507 option shares. Across five years of disclosure, the only identifiable change in a continuing director's personal position is a disposal.
The pricing of the grant decides whether it was compensation or a transfer at cost. The company bought its 166,515,100 treasury shares for $4.15 million — an average of 2.49 US cents a share at the rates of the day [3]. In rupiah, the exercise price handed to the directors was Rp383 against an average treasury cost of Rp383.2 [8]. Management bought the shares at what the company itself had paid for them, to the rupiah. In the quarter the options were exercised the stock traded between 2.36 and 2.71 US cents and closed the year at 2.45 cents [10], so the strike sat below the whole quarter's range. Against the year-end close, the intrinsic value of the directors' 12,110,584 options is $18,200 — 0.4% of the $4.28 million of cash pay the same directors drew that year. The equity element is real but immaterial in size; the price is what marks it as a transfer rather than an incentive.
Phase I of the scheme used 25,751,978 of an authorised 51,540,500 treasury shares. A further 25,788,522 options remain outstanding, 0.16% of the capital [11].
What the boards are paid, and the number that changed
Key management compensation — defined in the accounts as the Board of Commissioners and the Board of Directors — rose every year from $6.0 million in 2020 to $9.6 million in 2024, then fell to $5.4 million in 2025.
Sources: each year's own annual report — FY2021 [12], FY2022 [13], FY2023 [14], FY2024 [15], FY2025 [16].
The fall is not what the filings show when they are read against each other. The FY2024 annual report states, in the audited related-party note and again in the governance section, that the Board of Directors received $8.38 million and the Board of Commissioners $1.18 million in 2024 — $9.56 million in total [15] [17]. The FY2025 annual report, presenting 2024 as its comparative, states $4.43 million and $1.15 million — $5.59 million [16] [8]. The directors' line is $3.95 million lower, a cut of 47%; the total is $3.98 million lower, 41.6%.
Sources: FY2024 Annual Report, Balances and Transactions with Related Parties [15]; FY2025 Annual Report, Note 33 [16].
The 2023 figure is stable across the two filings that report it — $8.72 million in both the FY2023 and FY2024 reports [14] [15] — so this is not a general re-presentation of prior periods. It is confined to 2024. Nor is it an auditor changeover: the FY2023 accounts were audited by Purwantono, Sungkoro dan Surja [18], while the FY2025 accounts were audited by Tanubrata Sutanto Fahmi Bambang dan Rekan, whose signing partner the FY2025 report records as being in his second period of engagement — so the same firm signed the 2024 accounts [19]. One firm signed both versions of the 2024 number, and neither report carries a restatement note or a reconciliation.
An innocent explanation is available. Four board members — President Commissioner Ardy Hady Wijaya and directors Elly, Mitchella Ardy Hady Wijaya and Keith Ardy Hady Wijaya — resigned with effect from 31 January 2025 [20], and a departure package accrued in 2024 and later re-presented on a continuing-members basis would produce roughly this shape. Nothing in either filing says so. A $3.85 million movement in the disclosed pay of the people who run the company is not a rounding difference — it is 5.4% of the $71.8 million of profit attributable to owners in FY2025 — and until the two figures are reconciled, an investor reading the filings does not know what the 2024 board pay was.
On the number the FY2025 report now presents, board pay has fallen sharply against what owners earn. Measured on profit attributable to owners, key management compensation was 11.3% in FY2021 and 16.2% in FY2023; on the restated basis it was 8.7% in FY2024 and 7.5% in FY2025 [12] [16]. Spread across the eight directors in office at 31 December 2025, $4.28 million is an average of $535,000 each; across the six commissioners, $1.13 million is $188,000 each. Both boards changed composition during the year, so those averages are indicative rather than per-person disclosures.
The first half of 2026 turned the trend back up: $3.12 million against $2.57 million in the same half of 2025, a rise of 32.4% in rupiah [21]. Profit attributable to owners rose 38.0% over the same period, so pay grew slightly more slowly than the profit pool.
How pay is set
Individual remuneration is not disclosed. The company states plainly that it has decided not to publish the pay of each director and commissioner, citing confidentiality and the risk of recruitment by competitors, and discloses only the two aggregate totals [17] [8]. Those totals include tantiem, the Indonesian profit-share bonus [8].
The chain that sets the numbers is short and closed. The general meeting delegates the setting of commissioners' salaries, honoraria and allowances to the Major Shareholder — Eralink — and delegates the setting of directors' pay to the Board of Commissioners [22]. There is no separate nomination and remuneration committee; the company states that those functions are performed collectively by the Board of Commissioners [23]. Of the six commissioners at 31 December 2025, two are independent; President Commissioner Alexander Halim Kusuma and Commissioner Richard Halim Kusuma are each disclosed as having both a financial and a familial relationship with the major shareholder, as are President Director Budiarto Halim and Director Sintawati Halim [24].
This is a common structure for a family-controlled Indonesian issuer, and it is disclosed rather than concealed. It also means the controlling shareholder sets the pay of the body that sets the pay of the executives, with no independent committee in between and no individual figures published. The discipline on that arrangement is ownership: the same family bears 56.6% of anything excessive.
What has come back to shareholders
The dividend record is unbroken and the payout ratio has widened.
Sources: FY2022 Annual Report, Dividends and Dividend Policy [25]; FY2023 Annual Report [26]; FY2025 Annual Report [27]; Q2 FY2026 interim statements, Note 24 [28].
The 2025 fiscal year carried the largest dividend the company has declared: $0.0014 a share, $23.3 million in total, approved at the annual meeting on 29 June 2026 [28]. That is 32.5% of profit attributable to owners and, at $0.0212 a share, a yield of 6.5%. Add the $5.37 million of stock retired in five months — 1.6% of shares outstanding, an annualised 3.8% — and the total return of capital is running near 10% of market value a year. The company also states that no negative covenant restricts dividend payments [27], which sits alongside the bank approval rights catalogued in Funding and Covenants.
Board pay is a meaningful share of what owners take out. Cash dividends declared for the five years FY2021 to FY2025 total $104.2 million. Key management compensation over the same five years, taking each year as originally filed, totals $39.8 million — 38.2% of that dividend pool; on the restated 2024 figure, $35.9 million, or 34.2%. For every $100 declared to owners over five years, the two boards were paid roughly $34 to $38.
Source: derived from the dividend tables [25] [26] [27] [28] and the key management compensation notes [12] [13] [14] [15] [16].
Because the family's stake is measured against a shrinking share count, its cut of each dividend rises with every buyback. On the FY2025 dividend, Eralink's 8,800,291,400 shares collect $13.2 million of the $23.3 million declared — 56.6%, against the 55.09% the same holding would have taken on the December 2024 share count.
The read, and what would change it
The evidence supports a controlled company whose owner behaves like an owner. Eralink added 105 million shares in 2025, the company retired 251 million more in the first half of 2026, the dividend went to a record $0.0014 a share, and the family's economic interest rose from 55.09% to 56.56% in eighteen months without diluting anyone. For an investor who weighs alignment, that is the strongest fact in this chapter.
The fact that cuts hardest against it is that the alignment stops at the holding company. The executives who run the distribution business, negotiate with Apple and Samsung and decide how much inventory to carry own about a third of one percent between them; none of them bought a share in the open market in five years; the only equity they received was priced at the company's own average buyback cost; and one continuing director sold his entire holding. Meanwhile the disclosed pay of those boards for 2024 exists in two audited versions $4.0 million apart, with no reconciliation, and no individual figures are published. Control and cash return are demonstrable here. Executive alignment, on the disclosed record, is not.
Three things would move that read, in either direction. An open-market purchase by a director or commissioner reported to the exchange would convert the equity story from inherited to chosen. A reconciliation of the 2024 compensation figure in the FY2026 report, or an explanatory note, would close the largest disclosure gap in this chapter; its continued absence would widen it. And a second MESOP phase priced at market rather than at treasury cost, using the 25.8 million options still outstanding, would show the board treating equity as an incentive rather than a transfer.
Watch items with dates attached: any director or commissioner share transaction reported under OJK Regulation 11/2017 during 2026; whether the FY2026 annual report reconciles the FY2024 key management compensation figure; the terms of MESOP Phase II on the remaining 25,788,522 options; and whether the buyback continues past 30 June 2026 above the 2.14-cent average paid in the first half.
One limitation belongs on the page. Web research was unavailable during this pass, as it was for the preceding chapters, so exchange filings of insider transactions after 30 June 2026, any company statement on the 2024 compensation figure, and market commentary on the buyback could not be checked against sources outside the corpus. Everything above comes from the filings themselves.
Related Parties
Figures converted from Indonesian rupiah at historical FX rates — see data/company.json.fx_rates. Ratios, margins, and multiples are unitless and unchanged.
Erajaya is 55%-controlled by a founding family, trades at 0.65 times book, and a value buyer's first worry about such a structure is that value leaks to the controller before it reaches minority owners. On the transactional record it does not. In the first half of 2026, purchases from affiliates were 0.8% of the group's purchases and sales to affiliates were 0.01% of sales; the three balances that look new on the June 2026 sheet resolve to a declared dividend, an EV venture now controlled by Xpeng, and a device-insurance joint venture. The last uncovered claim on owner cash is a separate $107.1 million of input-VAT sitting with the tax office.
The transactional footprint is small
For a company that turns over $2.4 billion of goods a half-year, the related-party flows are minor. In the six months to 30 June 2026, Erajaya bought $17.8 million from affiliates — $11.5 million (0.54% of purchases) from PT Era Industri Otomotif and $6.3 million (0.29%) from PT Bolttech Device Protection Indonesia — and sold just $0.2 million to related parties, one hundredth of one percent of turnover [1]. There is no pattern here of revenue routed out to family vehicles at soft prices, or of the company buying its own goods back from an affiliate: the sales line to related parties is effectively empty.
Source: Q2 FY2026 statements, Note 33 — purchases 0.54% + 0.29% of group purchases; sales 0.01% of net sales [2].
The balances tell the same story. Related-party receivables at 30 June 2026 were negligible — $0.04 million of trade and $0.26 million of other receivables, the latter including $0.08 million owed by a subsidiary's minority shareholder [3]. The payables are larger, but three-quarters of the $29.6 million total is a single item that is not a related-party financing at all, as the next section shows.
Source: Q2 FY2026 statements, Note 33 balances [4]; nature of each relationship per Note 33 [5].
The three balances that look new
Three items appear at June 2026 that were absent or small at December 2025, and each resolves into something ordinary once the note is read.
The largest, a $21.4 million "Company's shareholders" other-payable, is the FY2025 cash dividend. The statement of changes in equity charges the identical $21.4 million as "Dividen kas — Perusahaan" against retained earnings in the half [6], and Note 33 classifies the payable as the dividend owed to shareholders under the AGM resolution of 29 June 2026 [7]. It sits under "related parties" only because the controller, Eralink, is one of the shareholders it is owed to; it is a pro-rata payable to the whole register, declared one day before the balance-sheet date and paid shortly after. The $0.46 million "subsidiary minorities" payable alongside it is the mirror item — dividends declared to the minority holders of the listed subsidiary SES.
The $11.5 million purchase from PT Era Industri Otomotif looks like a new affiliate supplier, but it is Erajaya's own venture seen from the far side of a disposal. Erajaya established the company through SES in November 2024 at 99.99%; on 8 May 2026 SES sold the majority of its shares to Xpeng International Holding (Hong Kong) Limited, a third party, and the entity became an associate [8]. The purchases are Erajaya distributing product for a Xpeng-controlled electric-vehicle venture — a partner-financed push into a new category, not a payment to the family. The transaction appears as "related-party" precisely because Erajaya sold control down; while it was wholly owned, the same flow was eliminated on consolidation.
The third, Bolttech, is a device-protection joint venture — the insurtech attached to phone sales. Erajaya bought $6.3 million of protection plans from it in the half (up from $3.5 million a year earlier) and earned $0.5 million of commission income back [9]. It is a genuine adjacency growing with the handset base, not a value transfer.
The channel has narrowed since listing
That the transactional channel is thin today is more reassuring against the record than in isolation. At the 2011 IPO the related-party page read very differently: the company's subsidiaries ESA and TAM bought four Jakarta properties directly from the founder Ardy Hady Wijaya ($0.5 million and $0.11 million apiece), the majority shareholder Eralink assumed $13.7 million of Erajaya's overdue receivables to clean the pre-listing balance sheet, and the family sold Erafone and SES shares into the group ahead of the offering [10]. Those are the classic promoter-entangled dealings of a pre-listing structure. Fifteen years on, the property purchases, receivable transfers and shareholder loans are gone; the affiliate flows are business-driven and under 1% of turnover.
The alignment questions that remain in a 55%-controlled company are not in this note — they are structural, and the report has already put them on the table: Eralink's stake creeping from 54.5% toward 56.6% on the outstanding count, the buybacks executed at the family's option strike, and board pay (Ownership and Pay), together with the growing slice of profit that accrues to the minority partners in the fastest-growing verticals (Minority Interests). The related-party transactions themselves are not where value is leaving.
The honest limit on this read is disclosure depth. Pricing rests on the Board of Directors' assertion that affiliated transactions "comply with the arm's length principle" and are reported to the regulator, with the Audit Committee reviewing them periodically and the FY2025 report recording no material conflict-of-interest transactions for the year [11]. There is no independent transfer-pricing study in the corpus, and the interim note gives no counterparty-level pricing detail. Given how small the flows are — a rounding error against $4.6 billion of annual sales — the exposure to mispricing is bounded even if every affiliate transaction were struck 10% off-market. What would change the read is scale: if purchases from the Xpeng venture or any family-linked supplier grew into the tens of millions of dollars and the pricing basis stayed on assertion, the channel would deserve a harder look.
One more claim on cash: input VAT
Setting the related-party channel aside, one large item on the asset side has not yet been given its own accounting: $107.1 million of prepaid taxes at 30 June 2026, which the filings state is "mainly value added tax — input" [12] [13]. This is a second, separate pile at the tax office, distinct from the Article 22 income-tax refund block that Tax Refund Block dissected. An importer-distributor pays 11% VAT on the goods it brings in and collects VAT on what it sells; when purchases and inventory run ahead of sales — as they have while the book grew — input VAT builds into a net receivable that can only be recovered through restitution on the tax authority's timetable.
Source: input-VAT (prepaid taxes) per Note 31 — Dec-2023 $48.5m and Dec-2024 $70.0m [14]; Dec-2025 $109.4m [15]; Jun-2026 $107.1m [16].
The pile has grown 2.6-fold in rupiah terms in two and a half years — from Rp745.6 billion at the end of 2023 to Rp1,947.2 billion at mid-2026, or $48.5 million to $107.1 million after currency drift — faster than sales, because the business grew and its purchasing is import-heavy [17] [18]. Placed next to the Article 22 income-tax refund claims — $0.7 million current plus $192.5 million non-current, $193.2 million in all [19] — the two together are $300.3 million, about 58% of the $521.4 million of equity attributable to owners [20].
At the tax office — VAT + income-tax claims ($m)
Share of equity attributable to owners
Source: input VAT $107.1m plus income-tax refund claims $193.2m (current + non-current) = $300.3m at 30 June 2026 [21]; against $521.4m owners' equity [22].
For a value buyer weighing margin of safety, the character of this money matters as much as its size. It is recoverable — VAT restitution is a statutory refund, not a doubtful receivable, and the income-tax half has a clean assessment history (Tax Refund Block) — so it is not a solvency question. But it is $107.1 million of owner cash the growth continuously advances to the state, on top of the $193.2 million income-tax block, with no restitution cycle, ageing schedule or assessment history disclosed for the VAT half. The filings never say how long an input-VAT balance takes to come back or whether the group even files for restitution rather than carrying it forward. That silence is the disclosure gap worth pressing: the cash is safe, but the report cannot yet say when it converts.
Taken with the related-party finding, the two remaining places a controlled distributor could be leaking or trapping owner cash come out differently. The affiliate channel is small and, on the record, clean; the tax office holds a large but recoverable balance that the growth keeps feeding. Neither is a place owner cash is being lost today — but the VAT pile is a standing item to watch, and the affiliate flows are worth re-checking if the Xpeng venture scales.